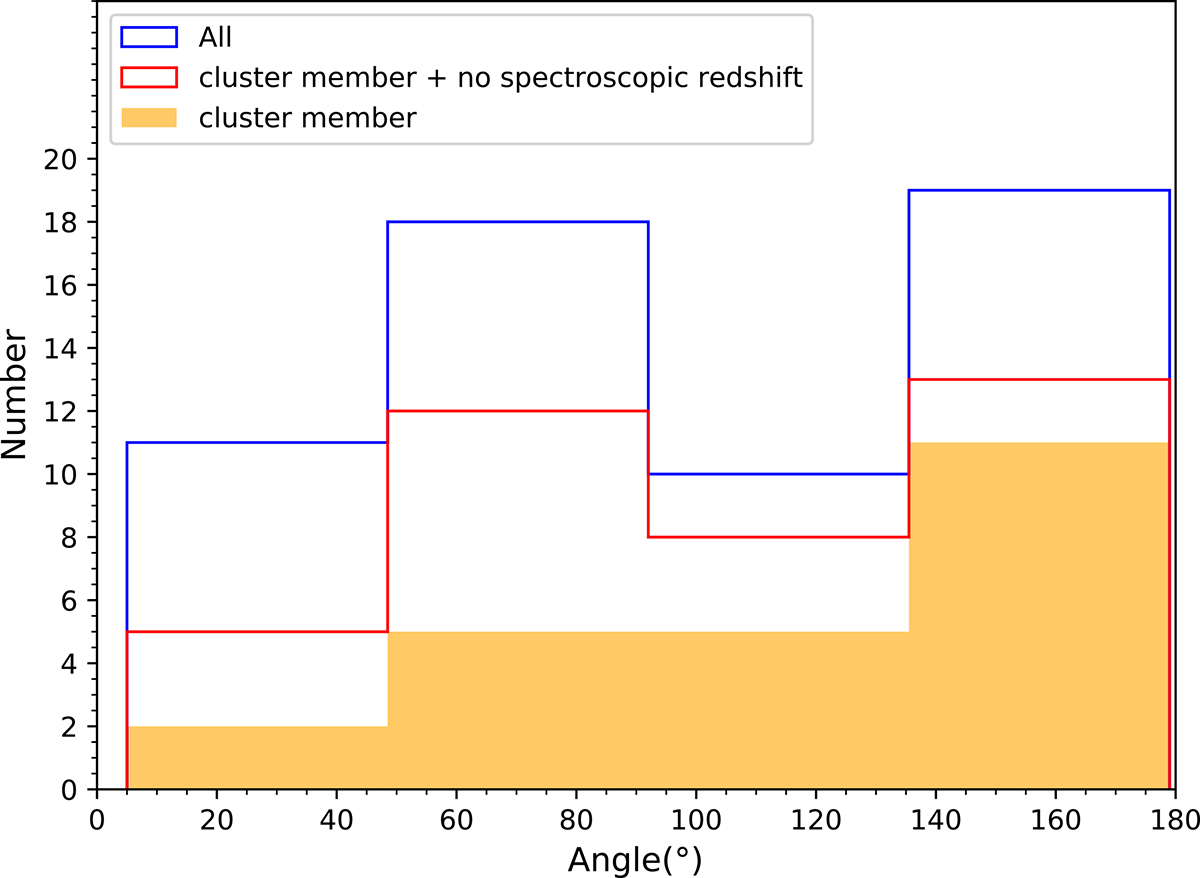
Fig. 5.
Download original image
Distribution of the angle between the direction of the tail and the direction towards the cluster centre. The tail angle distribution of all jellyfish candidates is given in blue. The distribution of candidates with a spectroscopic redshift matching with the associated cluster membership is shown in orange. The combined distribution of galaxies with no spectroscopic redshift and confirmed cluster membership are shown in red. We note that there are two peaks in distribution at 70° and 160° when we include all the candidates and also for galaxies with no redshift information.
Current usage metrics show cumulative count of Article Views (full-text article views including HTML views, PDF and ePub downloads, according to the available data) and Abstracts Views on Vision4Press platform.
Data correspond to usage on the plateform after 2015. The current usage metrics is available 48-96 hours after online publication and is updated daily on week days.
Initial download of the metrics may take a while.