Open Access
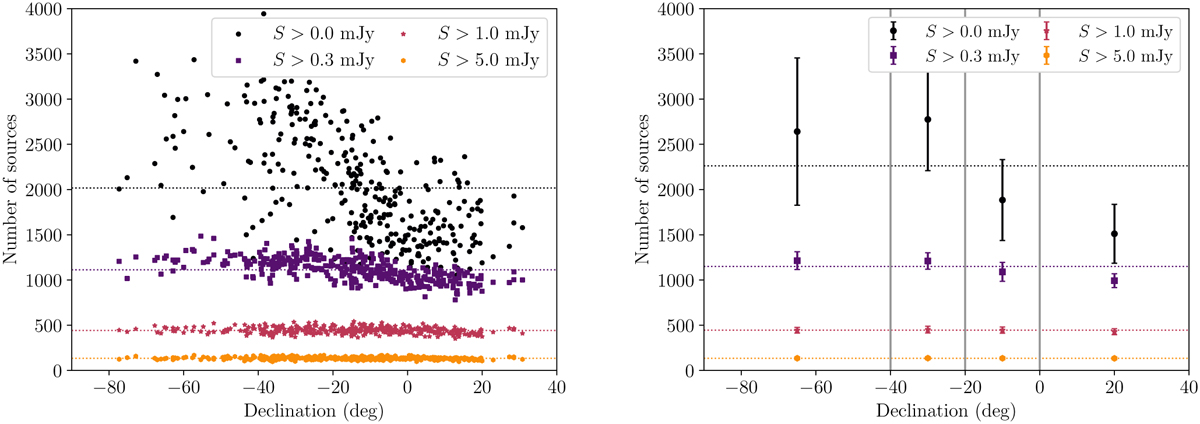
Fig. 7
Download original image
Number of sources per pointing (left) and binned averages (right) as a function of declination. The lowest cut includes all sources, and so goes down to around 50 µJy. Declination bins are chosen to have roughly the same amount of pointings in each bin. The edges of the bins are indicated by the solid grey lines.
Current usage metrics show cumulative count of Article Views (full-text article views including HTML views, PDF and ePub downloads, according to the available data) and Abstracts Views on Vision4Press platform.
Data correspond to usage on the plateform after 2015. The current usage metrics is available 48-96 hours after online publication and is updated daily on week days.
Initial download of the metrics may take a while.