Open Access
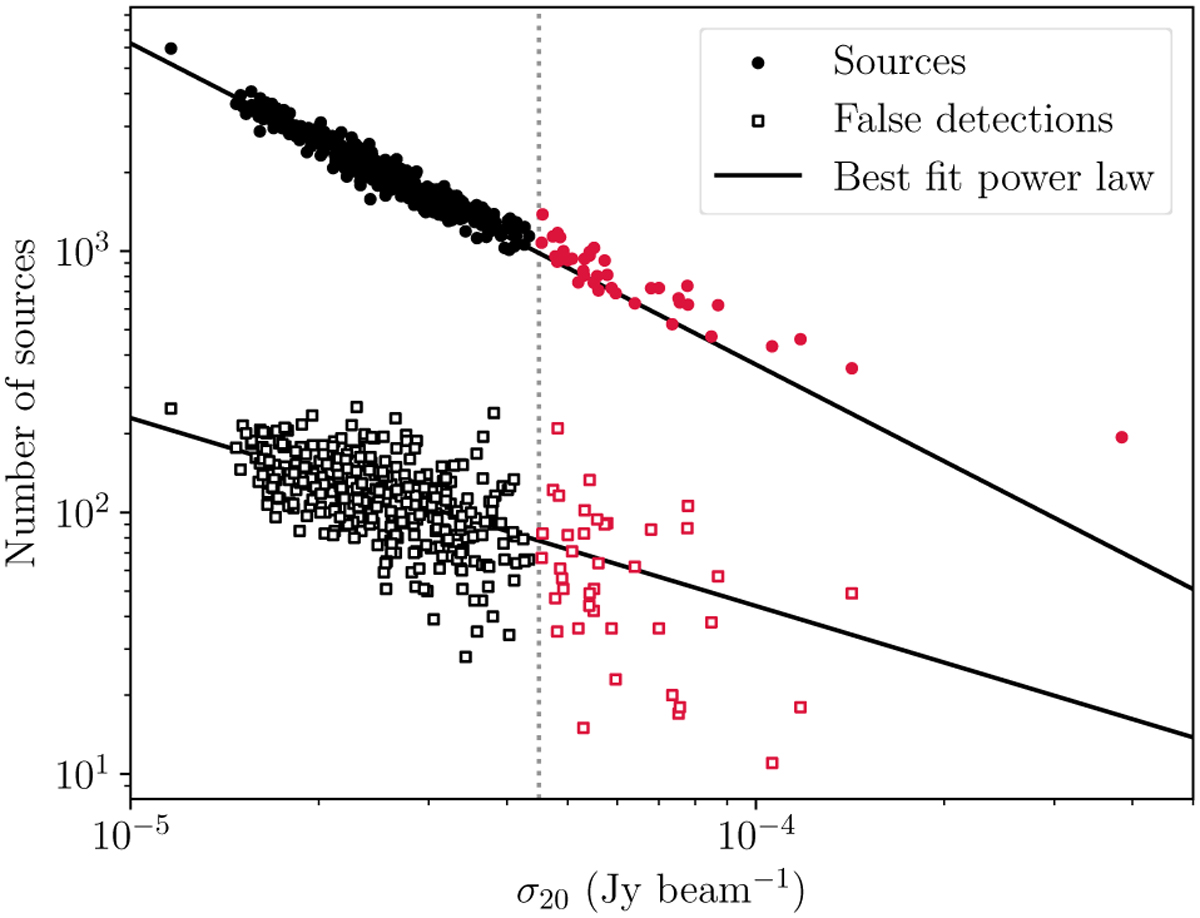
Fig. 6
Download original image
Number of sources in each pointing (filled circles), as well as the amount of artefacts flagged in each pointing (empty squares), as a function of σ20. The best fit power law to both distributions is shown by the black line, excluding all pointings with σ20 > 45 µJy beam−1, which are indicated by the red points.
Current usage metrics show cumulative count of Article Views (full-text article views including HTML views, PDF and ePub downloads, according to the available data) and Abstracts Views on Vision4Press platform.
Data correspond to usage on the plateform after 2015. The current usage metrics is available 48-96 hours after online publication and is updated daily on week days.
Initial download of the metrics may take a while.