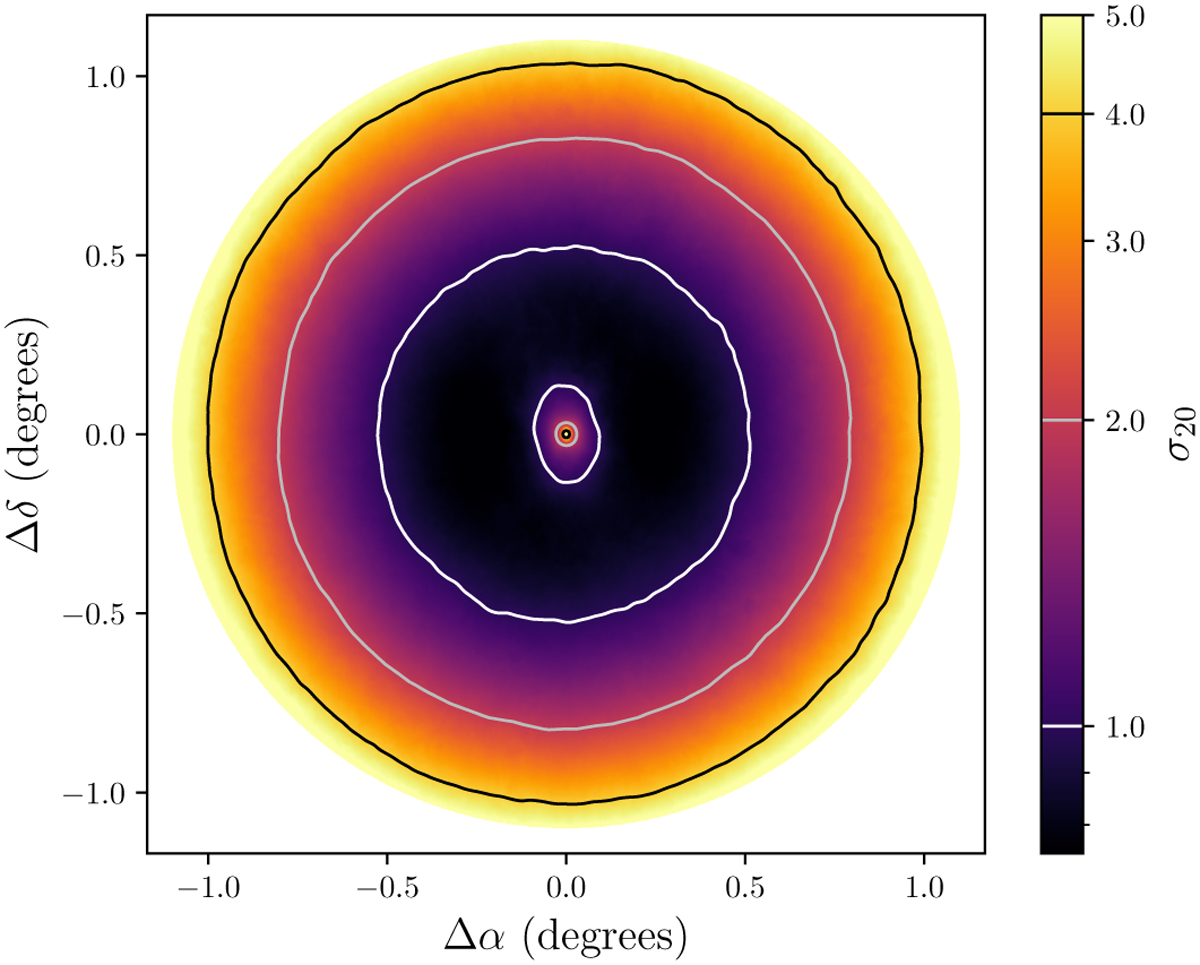
Fig. 5
Download original image
Median rms map of all 391 pointings as a function of σ20, showing increased noise in the pointing centre and towards the edges of the image. The contour lines show the levels (1, 2, 4) × σ20 in the image. For the pointing with the lowest <τ20, J2339-5523, the range l-5σ20 corresponds to 12–60 µJy beam−1. For the pointing with the highest σ20, J1244-0446, the range l–5σ20 corresponds to 0.4–2 mJy beam−1.
Current usage metrics show cumulative count of Article Views (full-text article views including HTML views, PDF and ePub downloads, according to the available data) and Abstracts Views on Vision4Press platform.
Data correspond to usage on the plateform after 2015. The current usage metrics is available 48-96 hours after online publication and is updated daily on week days.
Initial download of the metrics may take a while.