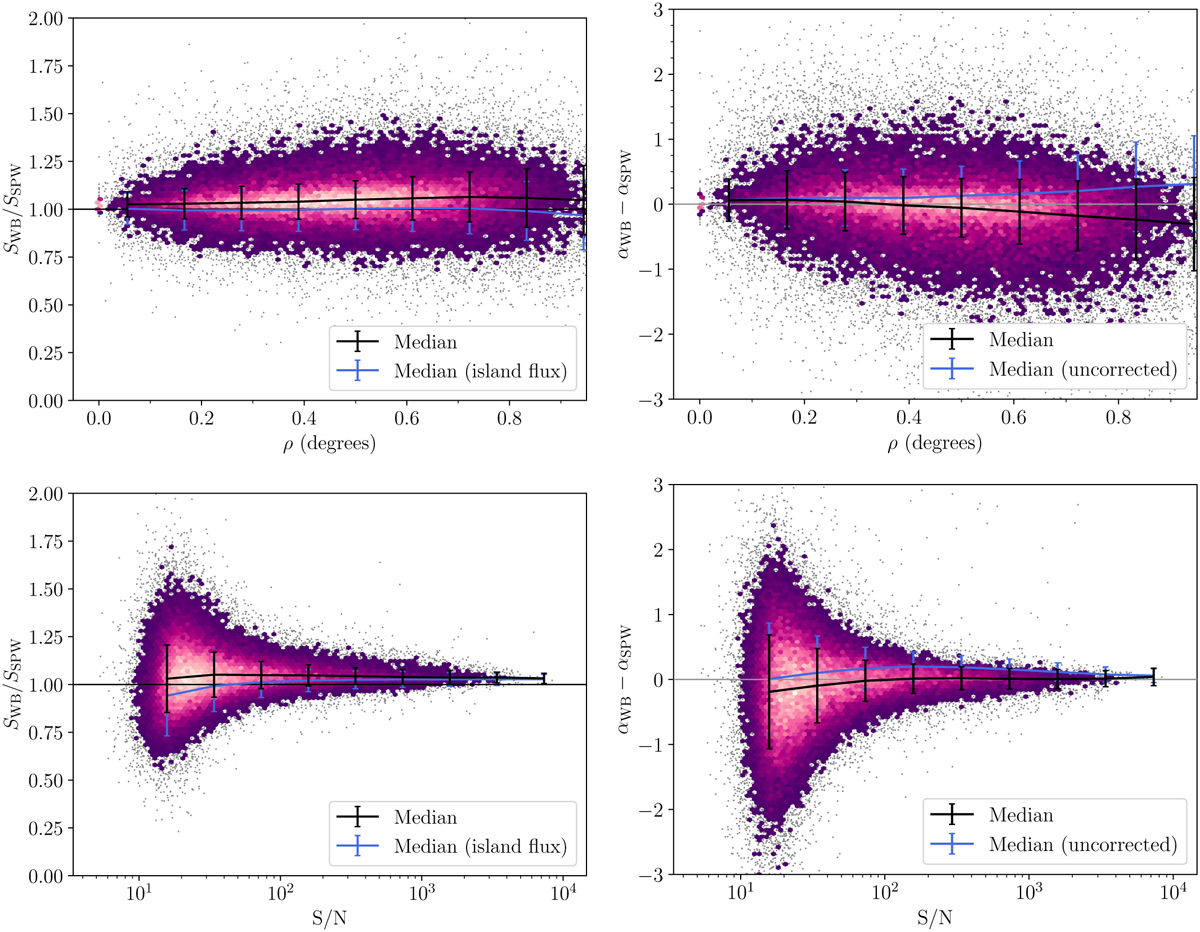
Fig. 4
Download original image
Comparison between the wideband catalogues and the MALS DR1 catalogues of flux densities (left) and spectral indices (right) as a function of distance from the pointing centre (top) and S/N (bottom). Wideband flux densities are compared with those of SPW2, while wideband spectral indices are compared with the spectral indices obtained from fitting between SPWs 2 and 9. Where the density of points is too high (more than five per bin), data is binned with the colour of the bin reflecting the amount of data points. A binned median and standard deviation is shown by the black errorbars in all plots. In the flux density comparison plots the binned median and standard deviation using the island flux are indicated by the blue errorbars. In the spectral index comparison plots, the blue errorbars show the binned median and standard deviation of the uncorrected values of αWB.
Current usage metrics show cumulative count of Article Views (full-text article views including HTML views, PDF and ePub downloads, according to the available data) and Abstracts Views on Vision4Press platform.
Data correspond to usage on the plateform after 2015. The current usage metrics is available 48-96 hours after online publication and is updated daily on week days.
Initial download of the metrics may take a while.