Fig. 3
Download original image
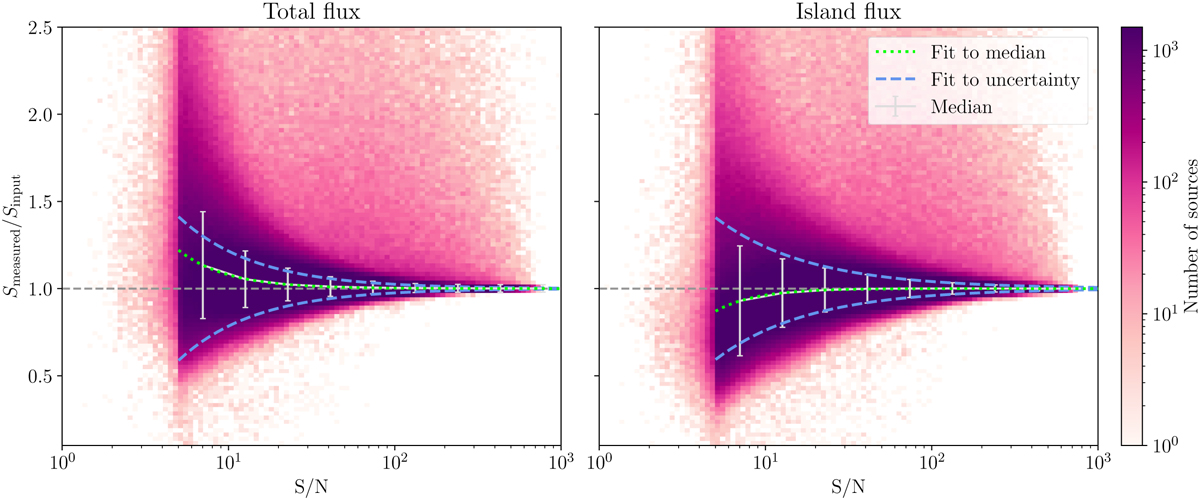
Two-dimensional histogram of the flux density recovery of sources as a function of S/N, for Total_flux (left) and Isl_Total_flux (right), measured from the completeness simulations from Paper I. The colour in the histogram indicates the number of sources in each bin. darker meaning more sources. The median and standard deviation on the recovered flux density are calculated in coarser S/N bins, shown with the light grey errorbars. These quantities are both fit separately, the blue dashed lines indicating the best fit to the uncertainties, the green dotted line indicating the best fit to the median flux ratio. We see that at low S/N, total flux is biased high, while island flux is biased low.
Current usage metrics show cumulative count of Article Views (full-text article views including HTML views, PDF and ePub downloads, according to the available data) and Abstracts Views on Vision4Press platform.
Data correspond to usage on the plateform after 2015. The current usage metrics is available 48-96 hours after online publication and is updated daily on week days.
Initial download of the metrics may take a while.