Fig. C.1
Download original image
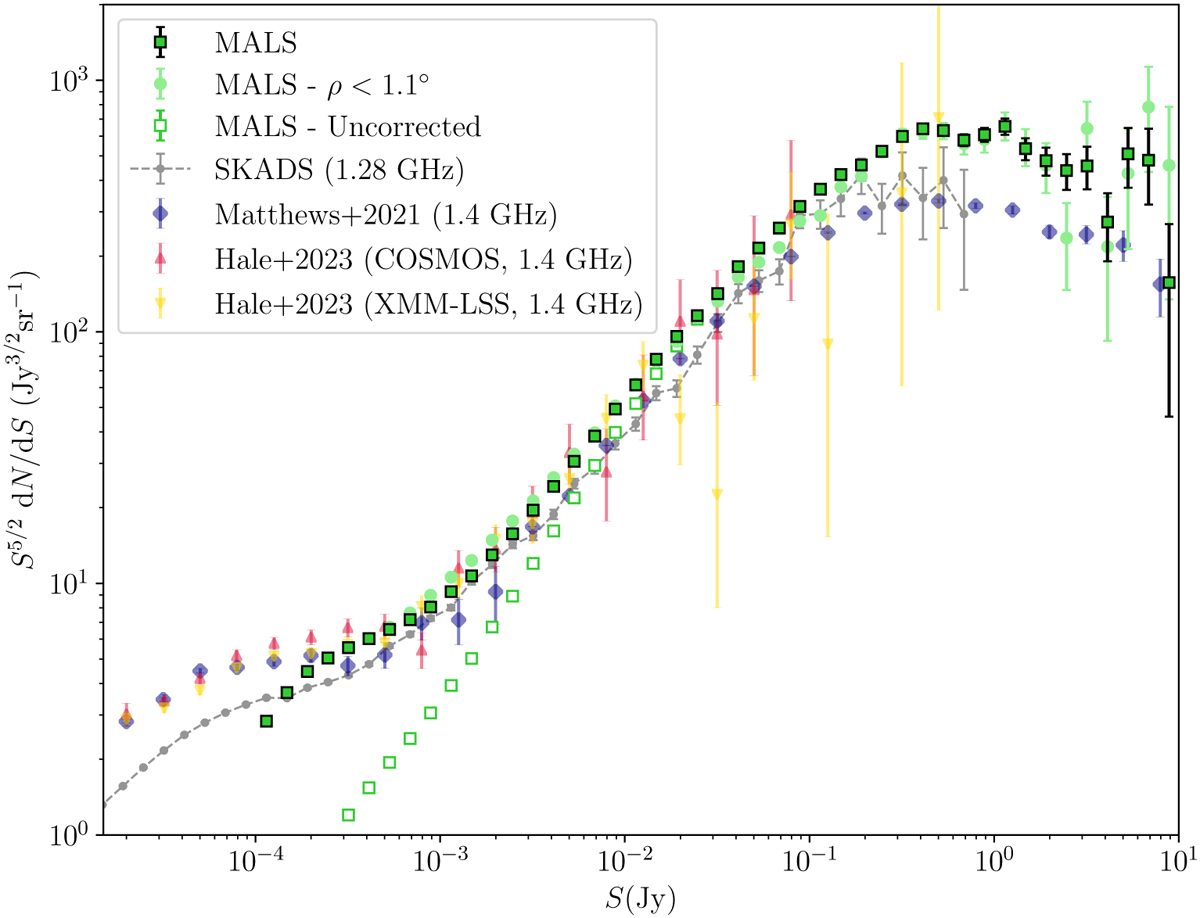
Differential source counts of MALS DR2 at 1.27 GHz. We show both the raw (uncorrected) counts (empty green squares) as well as the counts corrected for the sky area in which sources in each bin can be detected above 5σ of the local noise (filled green squares). This area was derived using the rms images produced by PYBDSF. We additionally show corrected source counts for the catalogue used for the dipole measurement, which only contains sources within 1.1° of each pointing centre (light green circles). For comparison, we show the 1.28 GHz source counts derived from SKADS (grey, Wilman et al. 2008), the combined DEEP2 and NVSS source counts from Matthews et al. (2021) in blue, and the MIGHTEE modified SKADS corrected source counts for the COSMOS (red) and XMM-LSS (yellow) fields from Hale et al. (2023). At the faint end, the sky coverage corrections produce reliable source counts down to 200 µJy.
Current usage metrics show cumulative count of Article Views (full-text article views including HTML views, PDF and ePub downloads, according to the available data) and Abstracts Views on Vision4Press platform.
Data correspond to usage on the plateform after 2015. The current usage metrics is available 48-96 hours after online publication and is updated daily on week days.
Initial download of the metrics may take a while.