Fig. 14
Download original image
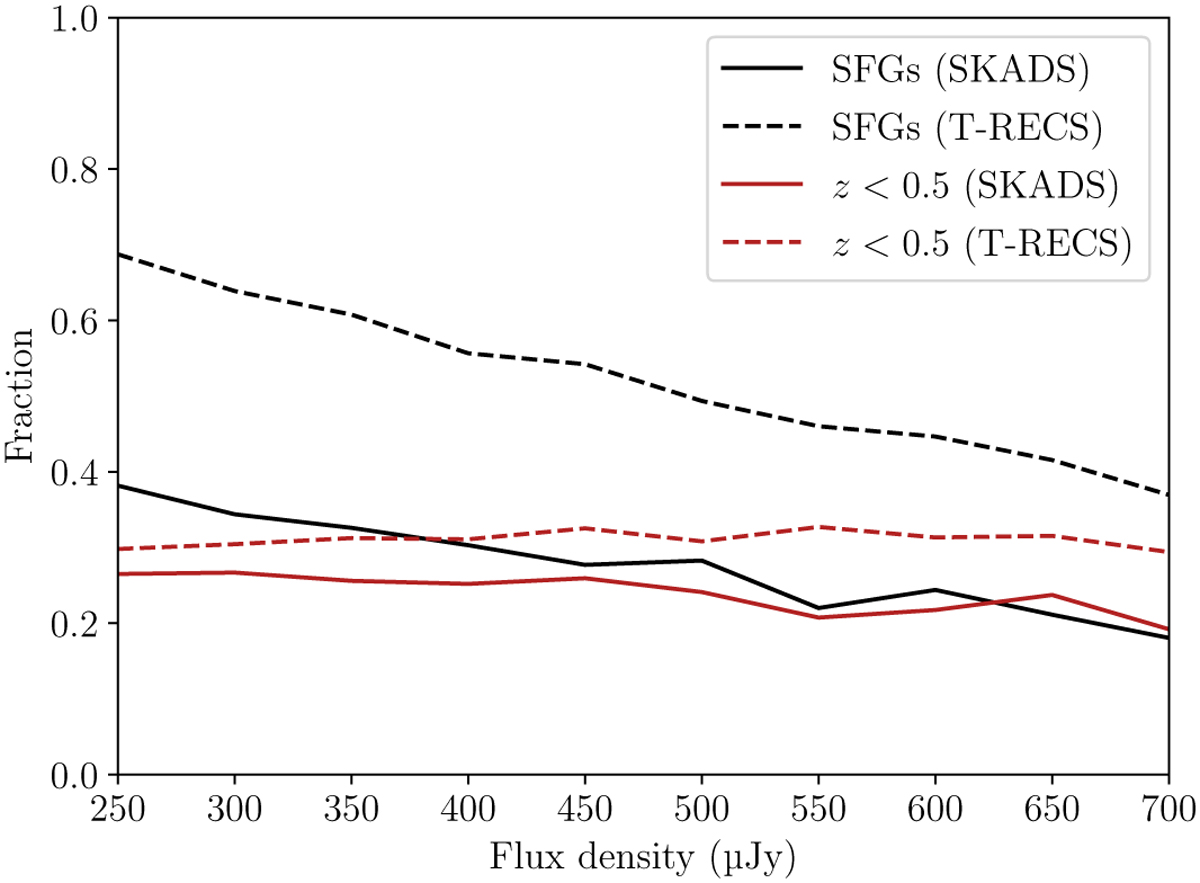
Fractions of SFGs (black lines) and sources below ɀ = 0.5 (red line) for both SKADS (solid lines) and T-RECS (dashed lines) simulations, for the different flux densities at which the MALS dipole measurement has been made. Notably, the fraction of SFGs is much higher in T-RECS, while the fraction of source sources below ɀ = 0.5 is consistent between both simulations.
Current usage metrics show cumulative count of Article Views (full-text article views including HTML views, PDF and ePub downloads, according to the available data) and Abstracts Views on Vision4Press platform.
Data correspond to usage on the plateform after 2015. The current usage metrics is available 48-96 hours after online publication and is updated daily on week days.
Initial download of the metrics may take a while.