Fig. 11
Download original image
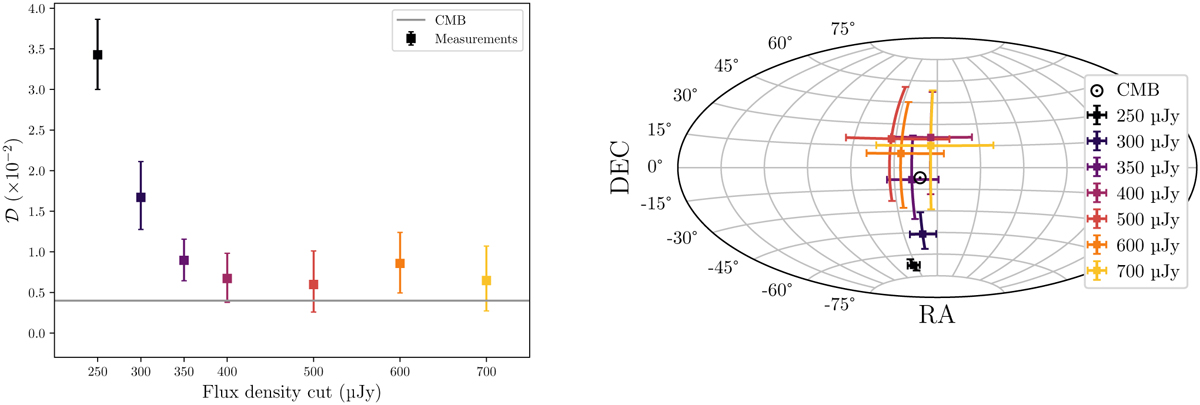
Measurements of the MALS dipole amplitude (left) and direction (right) from Table 2 for different flux density cuts. The expected dipole amplitude from CMB measurements is indicated by the grey line (left) and CMB position by the dot in circle (right). Though lower flux density cuts are ostensibly still affected by the declination systematic, at higher flux densities the fits seems to converge towards a spot close to the direction of the CMB dipole. Similarly, the amplitudes also converge to an amplitude that is close to the CMB amplitude.
Current usage metrics show cumulative count of Article Views (full-text article views including HTML views, PDF and ePub downloads, according to the available data) and Abstracts Views on Vision4Press platform.
Data correspond to usage on the plateform after 2015. The current usage metrics is available 48-96 hours after online publication and is updated daily on week days.
Initial download of the metrics may take a while.