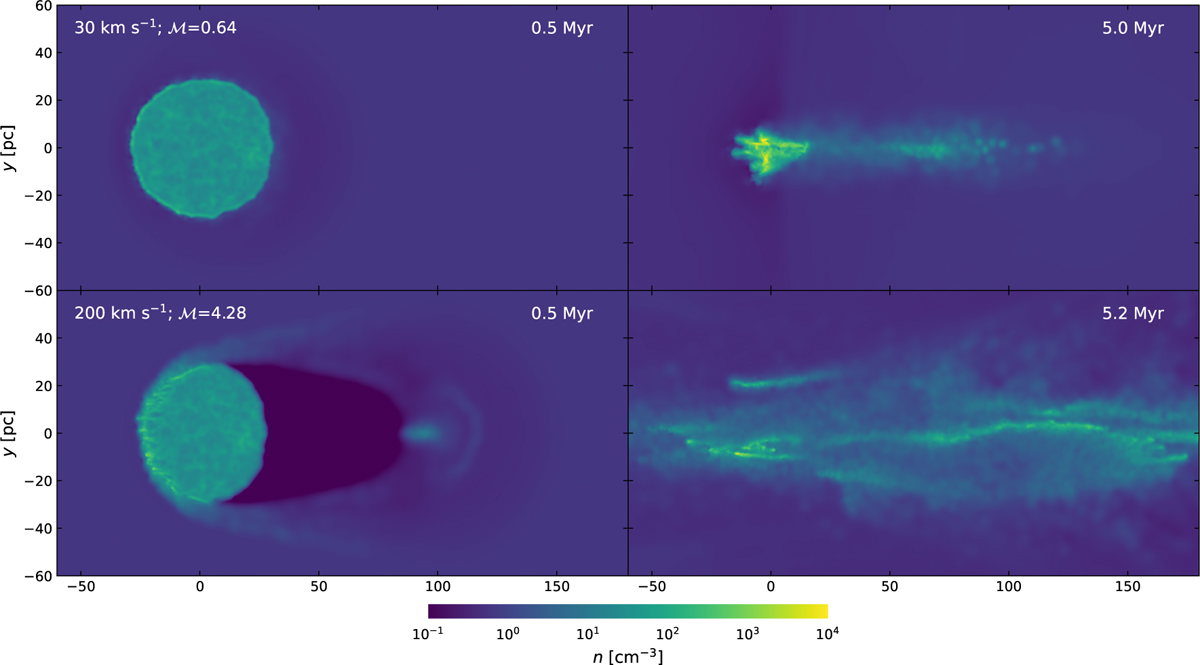
Fig. 5
Download original image
Particle density slices of a 105 M⊙ molecular cloud embedded in a 105 K outflow. The left column shows the system’s state after 0.5 Myr, the right one - at tfrag. Outflow velocity (Mach number), indicated at the top left of each panel is 30 km s−1 (ℳ = 0.64) in the top row and 200 km s−1 (ℳ = 4.28) in the bottom one. Coordinates are centred on the cloud centre of mass, with outflow velocity in the positive x direction. For a complete set of clouds in 105 K outflows and equivalent plots of clouds in 104 K and 106 K outflows, see Appendix B.
Current usage metrics show cumulative count of Article Views (full-text article views including HTML views, PDF and ePub downloads, according to the available data) and Abstracts Views on Vision4Press platform.
Data correspond to usage on the plateform after 2015. The current usage metrics is available 48-96 hours after online publication and is updated daily on week days.
Initial download of the metrics may take a while.