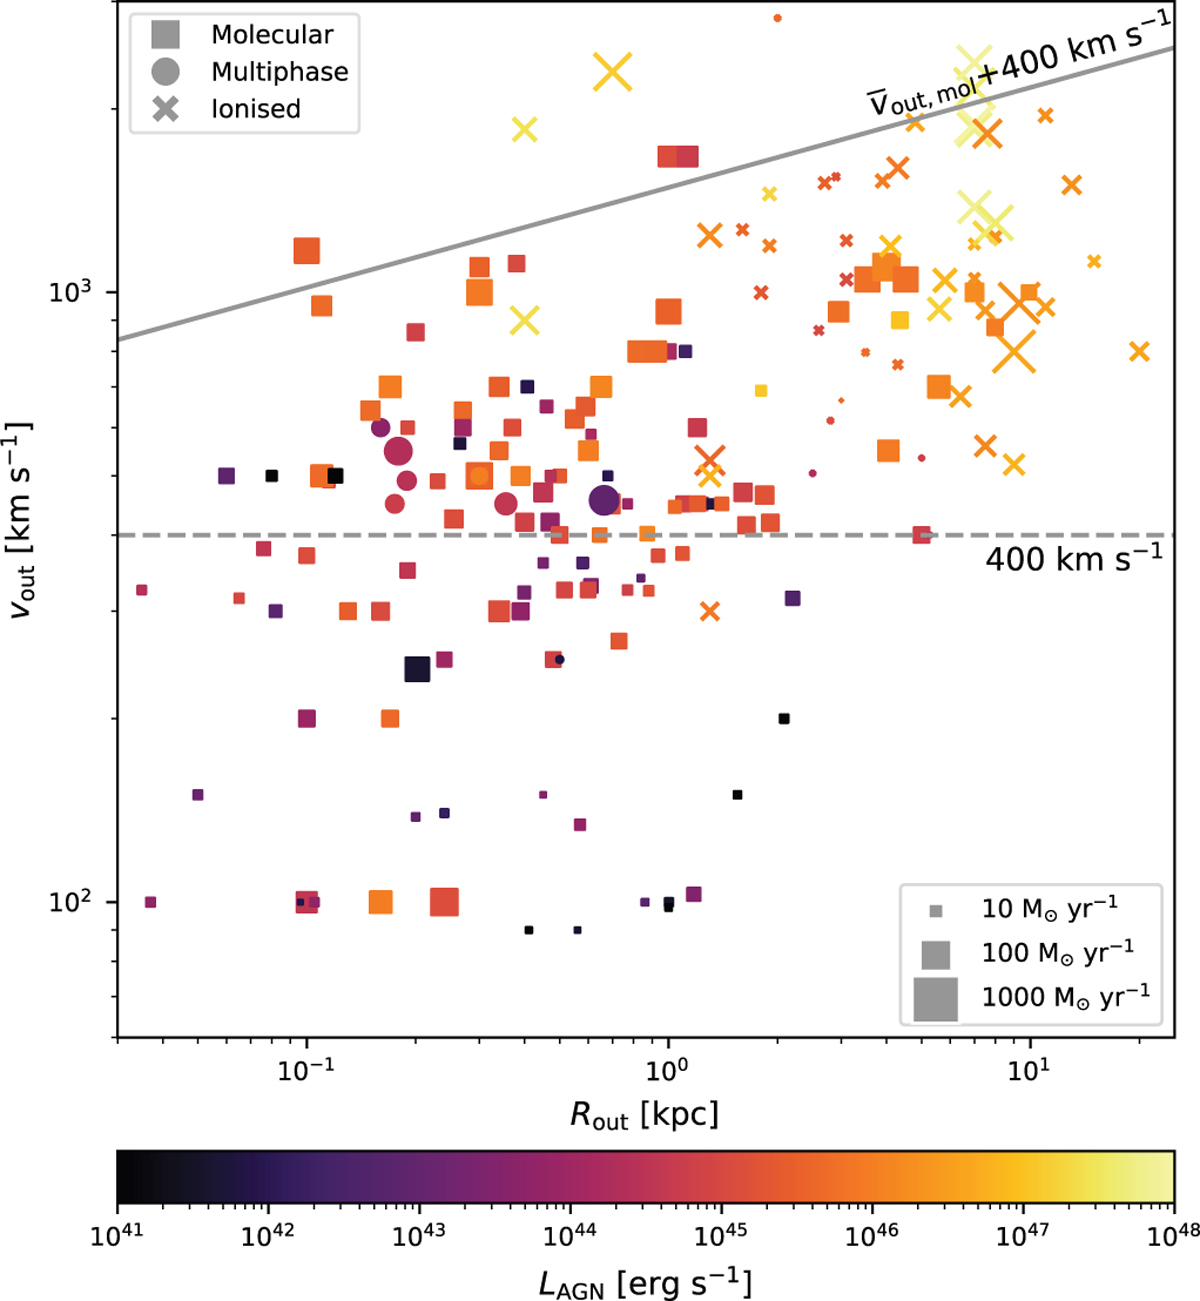
Fig. 2
Download original image
Compilation of observed outflow velocities and radial distances. The symbol indicates the detected gas phase, symbol size – mass outflow rate (Ṁ). The colour indicates the AGN luminosity. The oblique continuous line shows the average Ṁ-weighted velocity of molecular outflows shifted by ∆υout = 400 km s−1. The horizontal dashed line shows the upper velocity limit for outflows simulated in this work. Data aggregated from compilations in Fiore et al. (2017); Fluetsch et al. (2019); Lutz et al. (2020); Zubovas et al. (2022).
Current usage metrics show cumulative count of Article Views (full-text article views including HTML views, PDF and ePub downloads, according to the available data) and Abstracts Views on Vision4Press platform.
Data correspond to usage on the plateform after 2015. The current usage metrics is available 48-96 hours after online publication and is updated daily on week days.
Initial download of the metrics may take a while.