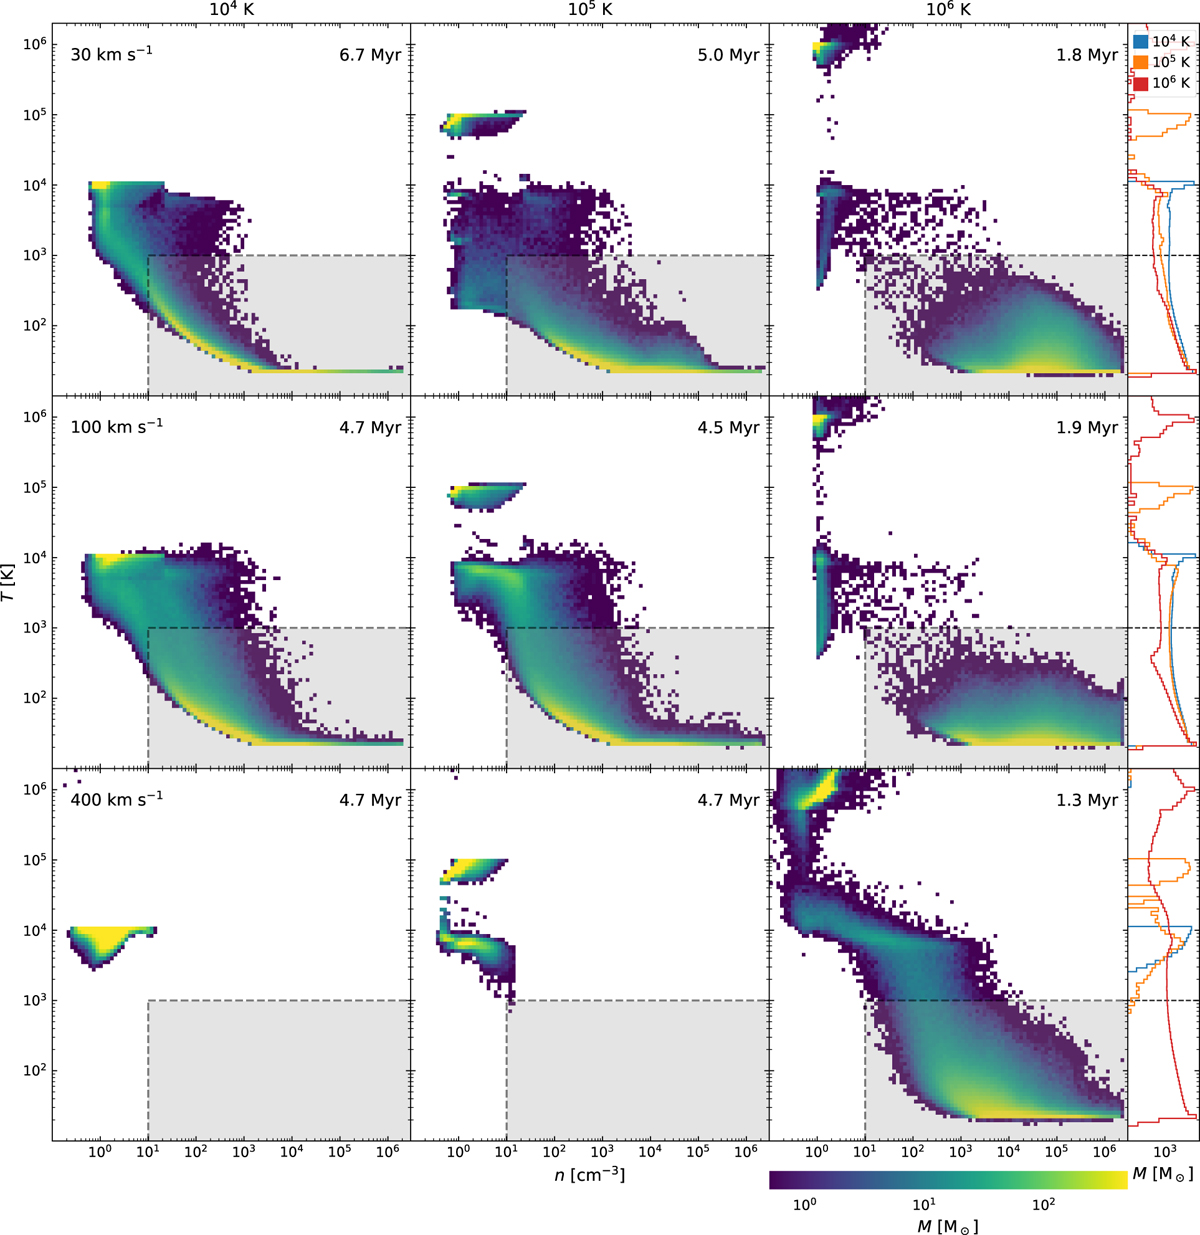
Fig. C.1
Download original image
Temperature, number density histograms of 105 M⊙ clouds at fragmentation time (given in the upper right corner) with outflow temperatures of 104, 105, 106 K (from left to right). Outflow velocity increases in rows − 30, 100, 400 km s−1. The rightmost column shows the total gas mass in each temperature bin. The gas in the grey area is considered to comprise the molecular cloud.
Current usage metrics show cumulative count of Article Views (full-text article views including HTML views, PDF and ePub downloads, according to the available data) and Abstracts Views on Vision4Press platform.
Data correspond to usage on the plateform after 2015. The current usage metrics is available 48-96 hours after online publication and is updated daily on week days.
Initial download of the metrics may take a while.