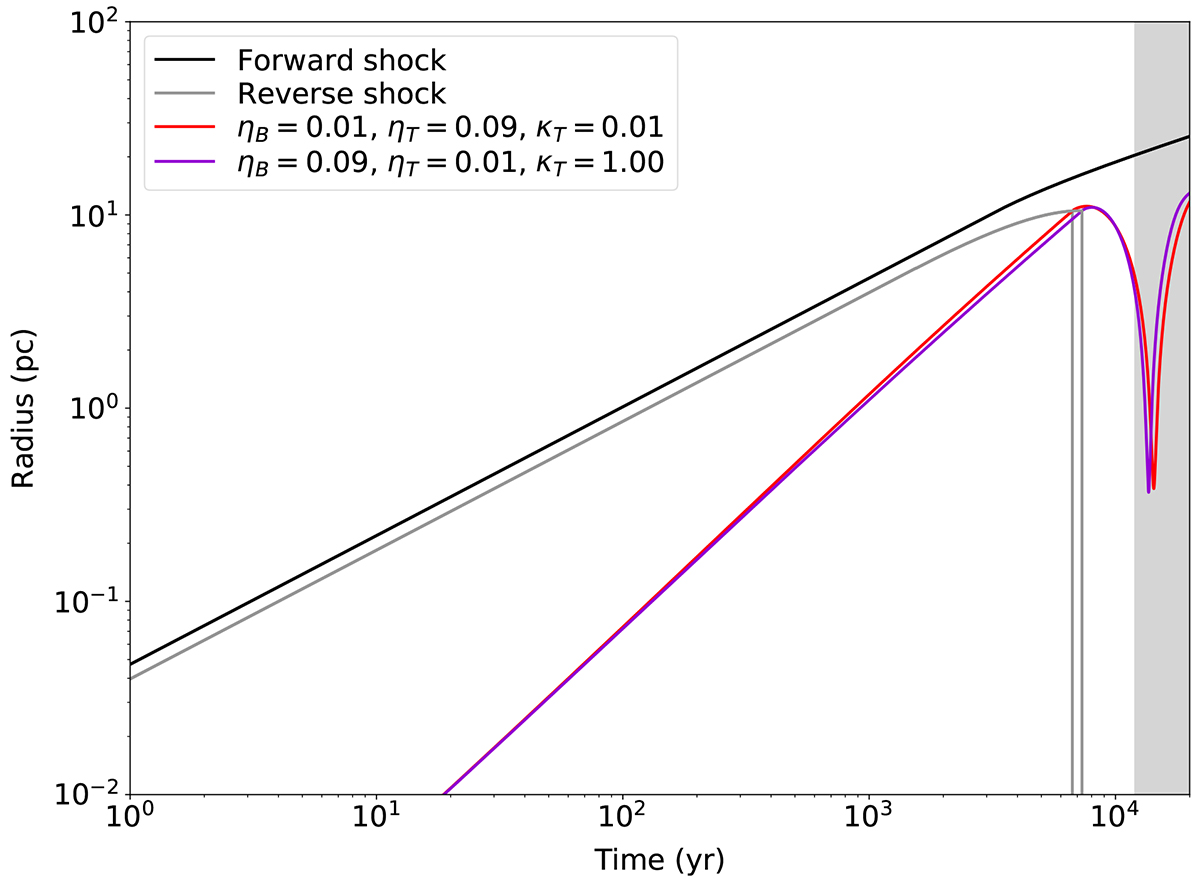
Fig. 1.
Download original image
Evolution of the size of the PWN for the two extreme model setups. Also shown as reference are the radii for the forward and reverse shocks of the SNR. The curves for the other setups lie in between the red and purple curves. In this and subsequent figures, the gray shaded area denotes the strong compression phase that the model is not suited to describe.
Current usage metrics show cumulative count of Article Views (full-text article views including HTML views, PDF and ePub downloads, according to the available data) and Abstracts Views on Vision4Press platform.
Data correspond to usage on the plateform after 2015. The current usage metrics is available 48-96 hours after online publication and is updated daily on week days.
Initial download of the metrics may take a while.