Open Access
Fig. 5.
Download original image
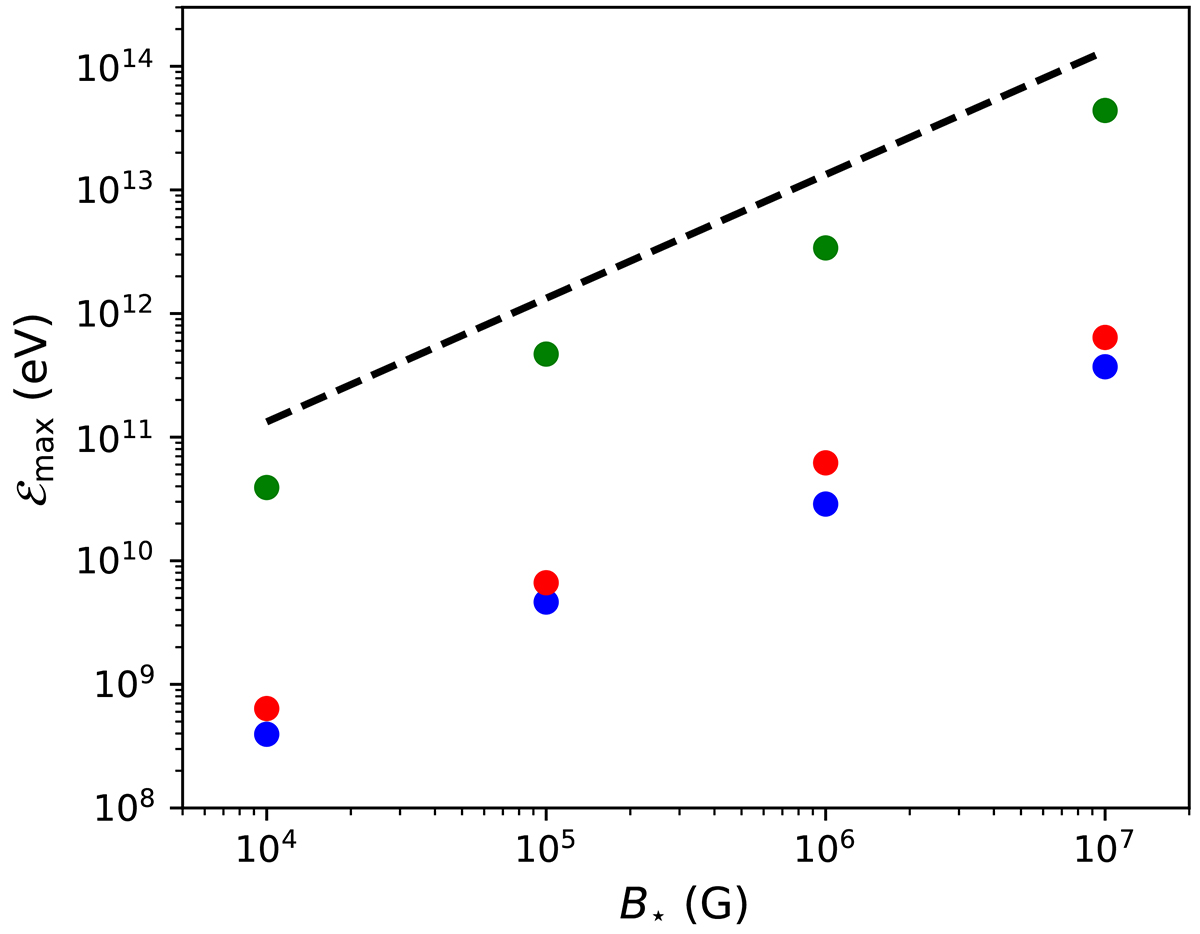
Maximum cut-off energy of the charged particle energy distributions, ℰmax (electrons: blue dots; positrons: red dots; protons: green dots), as a function of the surface magnetic field B⋆. The evolution of the polar-cap potential drop is shown by the dashed line for comparison (Eq. 4).
Current usage metrics show cumulative count of Article Views (full-text article views including HTML views, PDF and ePub downloads, according to the available data) and Abstracts Views on Vision4Press platform.
Data correspond to usage on the plateform after 2015. The current usage metrics is available 48-96 hours after online publication and is updated daily on week days.
Initial download of the metrics may take a while.