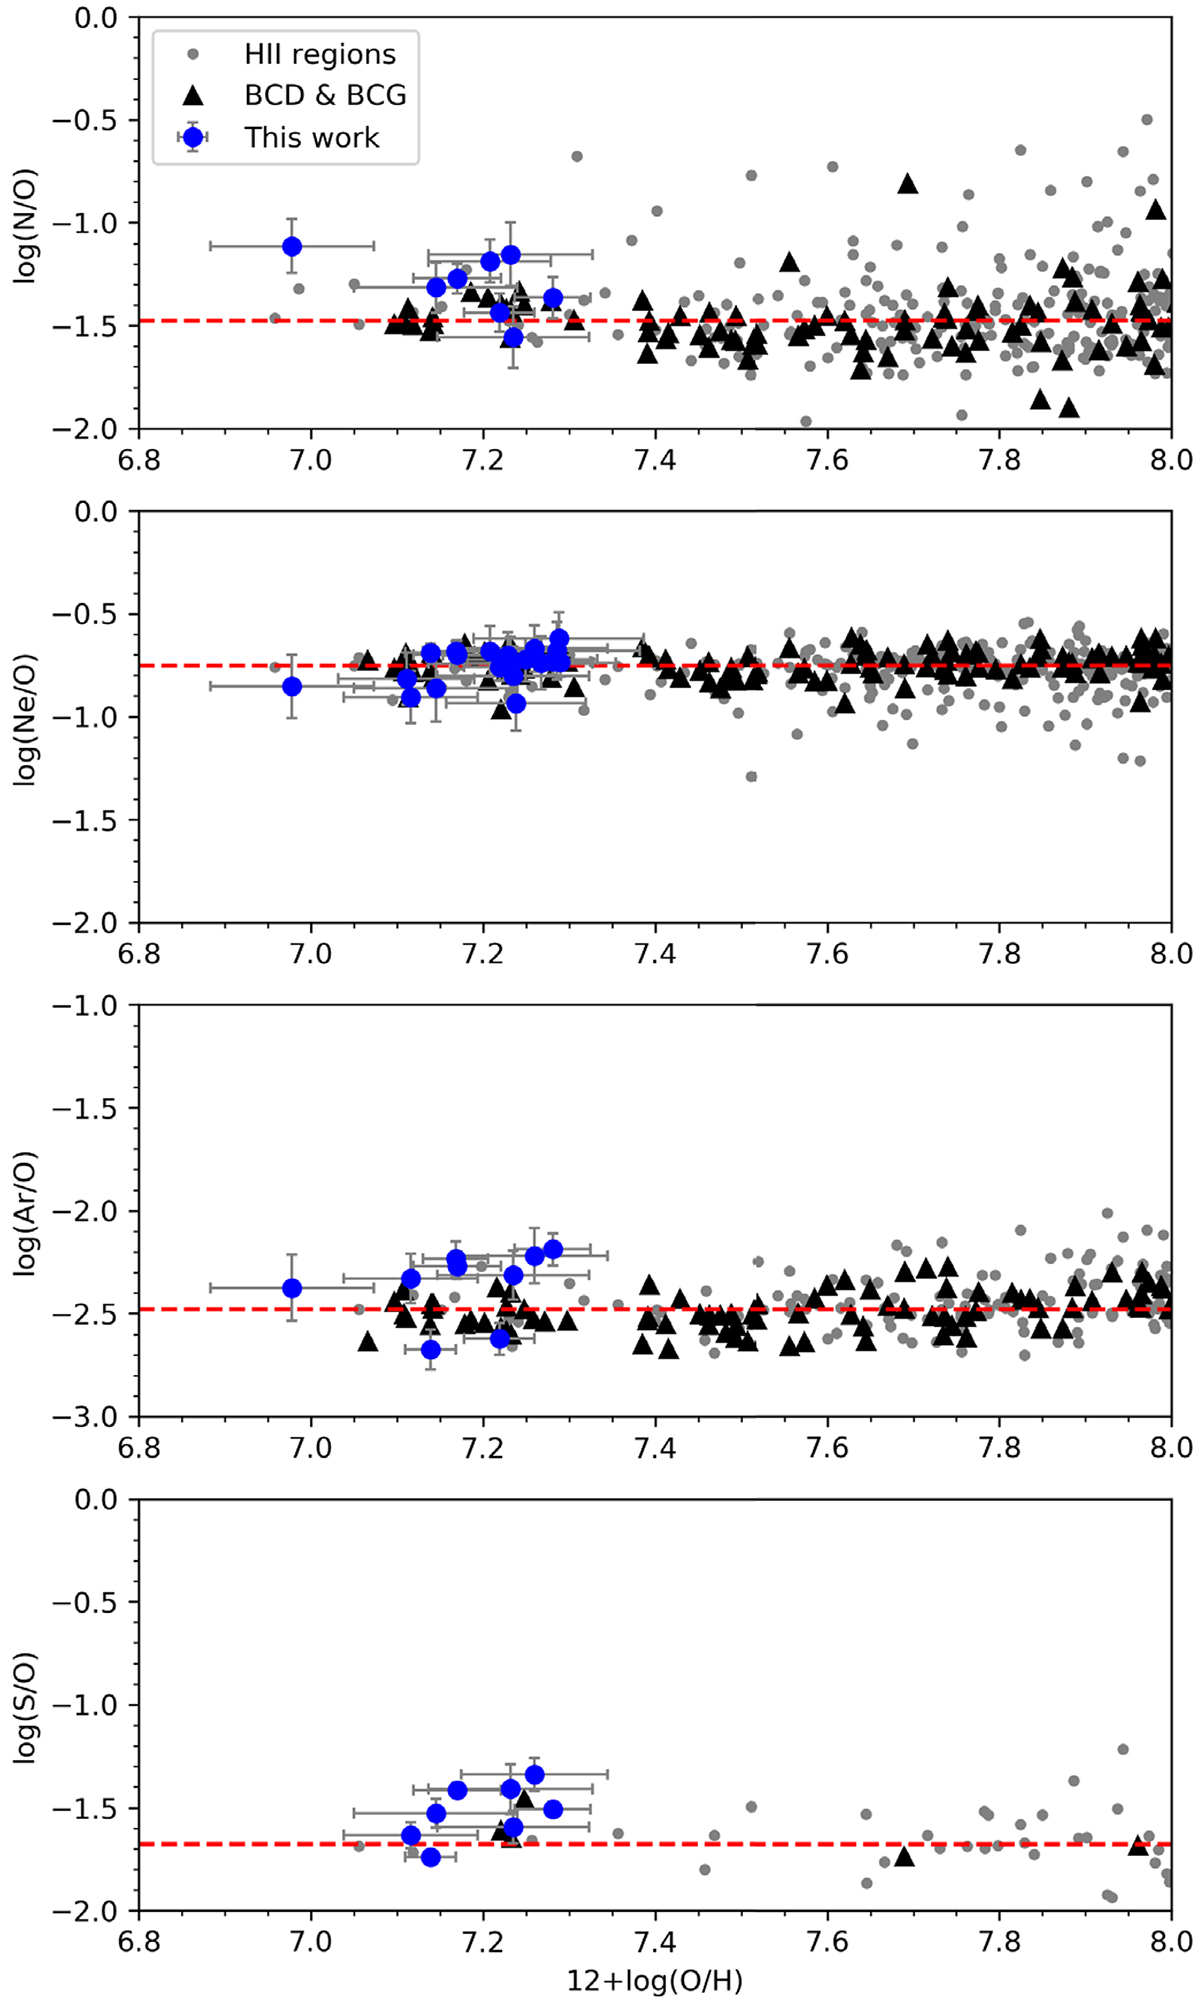
Fig. 4.
Download original image
N/O, Ne/O, Ar/O, and S/O ratios with respect to oxygen abundance. Blue circles are our sample of extremely metal-poor galaxies. Gray points and black triangles represent a reference sample of H II regions and BCD/BCG galaxies, respectively, with measured oxygen auroral line collected from the literature. Red dashed lines are medians of N/O, Ne/O, Ar/O, and S/O for the reference H II regions with O/H in the range 7.0−8.0 dex.
Current usage metrics show cumulative count of Article Views (full-text article views including HTML views, PDF and ePub downloads, according to the available data) and Abstracts Views on Vision4Press platform.
Data correspond to usage on the plateform after 2015. The current usage metrics is available 48-96 hours after online publication and is updated daily on week days.
Initial download of the metrics may take a while.