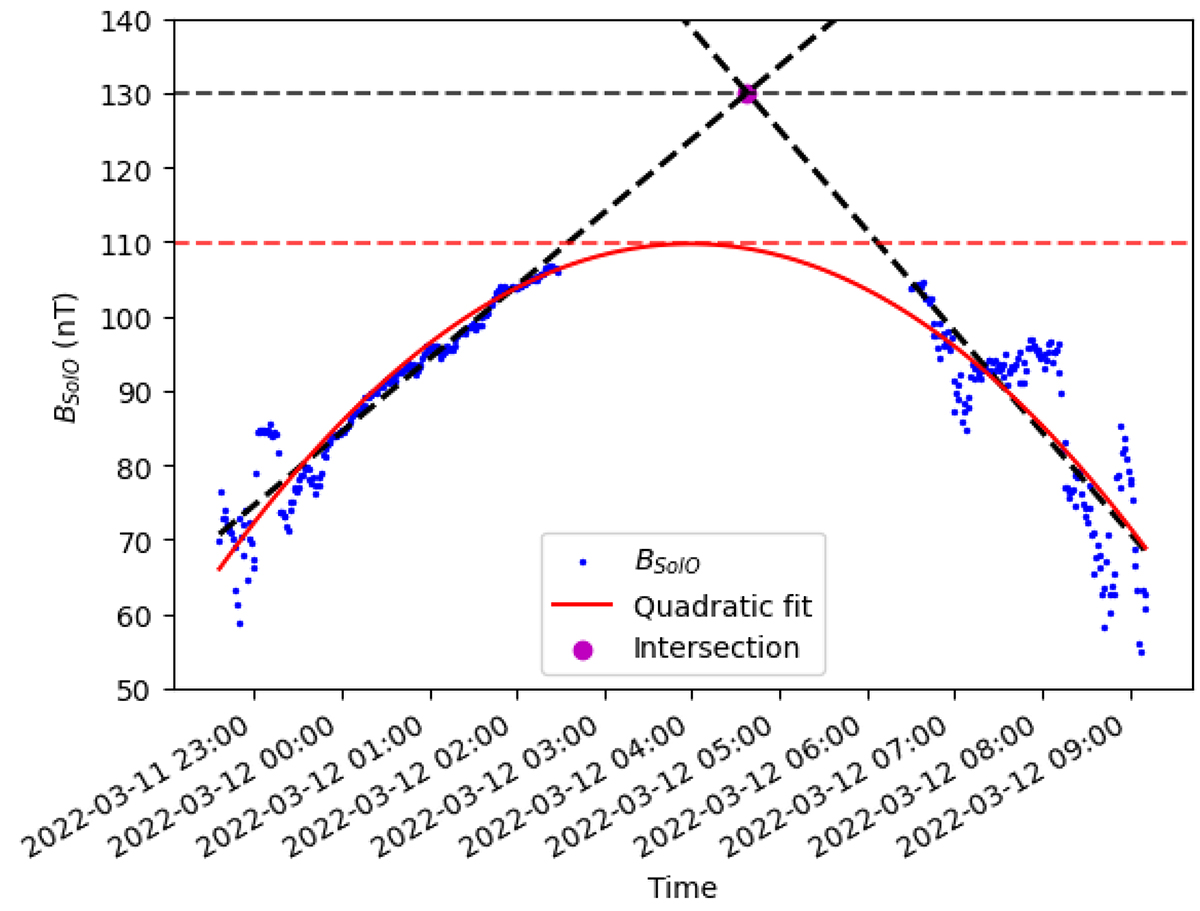
Fig. A.1.
Download original image
Scattered blue data points show in situ measurements of BSolO over time. The red curve represents the quadratic fit approximating the data trends. Extrapolated linear fits of BSolO nT and their intersection point (magenta dot) suggest potential B0SolO at 0.43 AU.
Current usage metrics show cumulative count of Article Views (full-text article views including HTML views, PDF and ePub downloads, according to the available data) and Abstracts Views on Vision4Press platform.
Data correspond to usage on the plateform after 2015. The current usage metrics is available 48-96 hours after online publication and is updated daily on week days.
Initial download of the metrics may take a while.