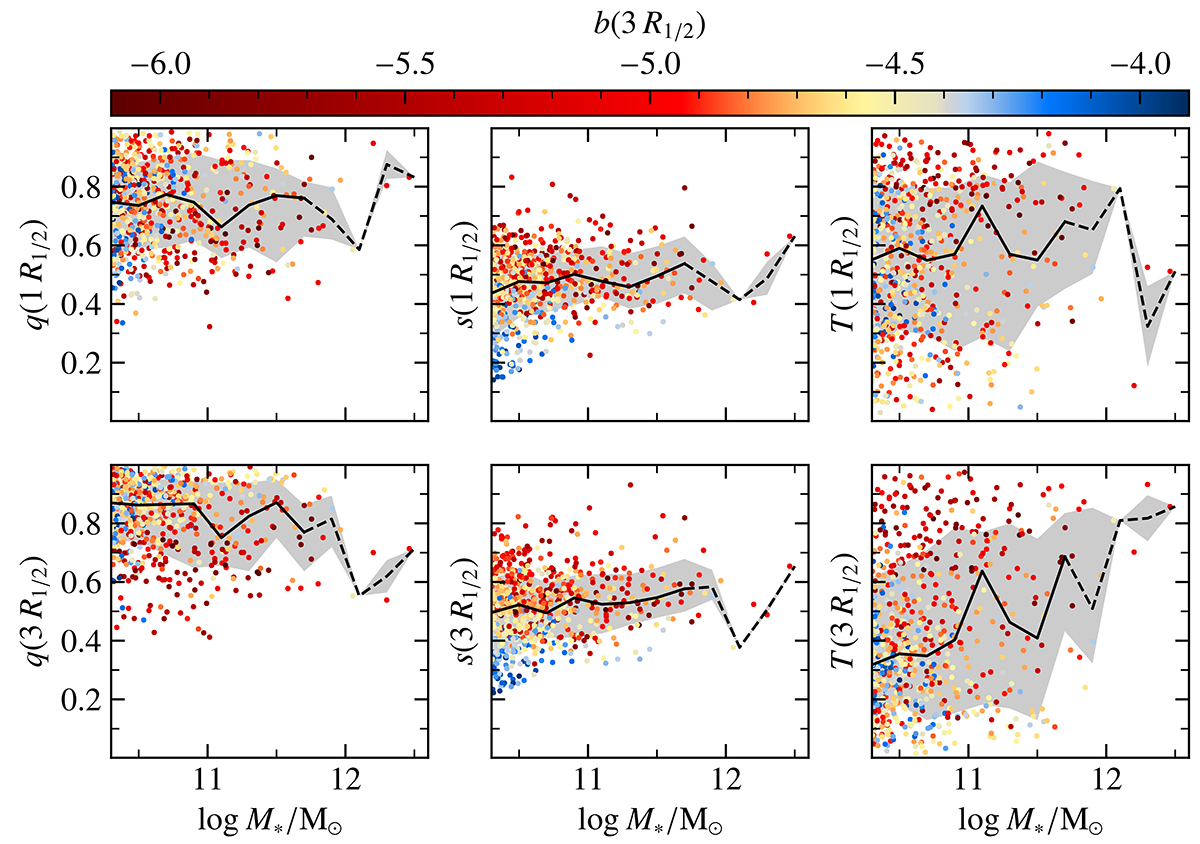
Fig. 9.
Download original image
Relation between shape parameters at one (top row) and three (bottom row) stellar half-mass radii and the stellar mass, colored by the b-value. The black lines indicate the median values in the respective mass bins and the shaded regions the 1σ ranges (containing 68% of the galaxies above and below the median). The dashed part of the lines indicates where there may be effects caused by low number statistics.
Current usage metrics show cumulative count of Article Views (full-text article views including HTML views, PDF and ePub downloads, according to the available data) and Abstracts Views on Vision4Press platform.
Data correspond to usage on the plateform after 2015. The current usage metrics is available 48-96 hours after online publication and is updated daily on week days.
Initial download of the metrics may take a while.