Fig. C.1.
Download original image
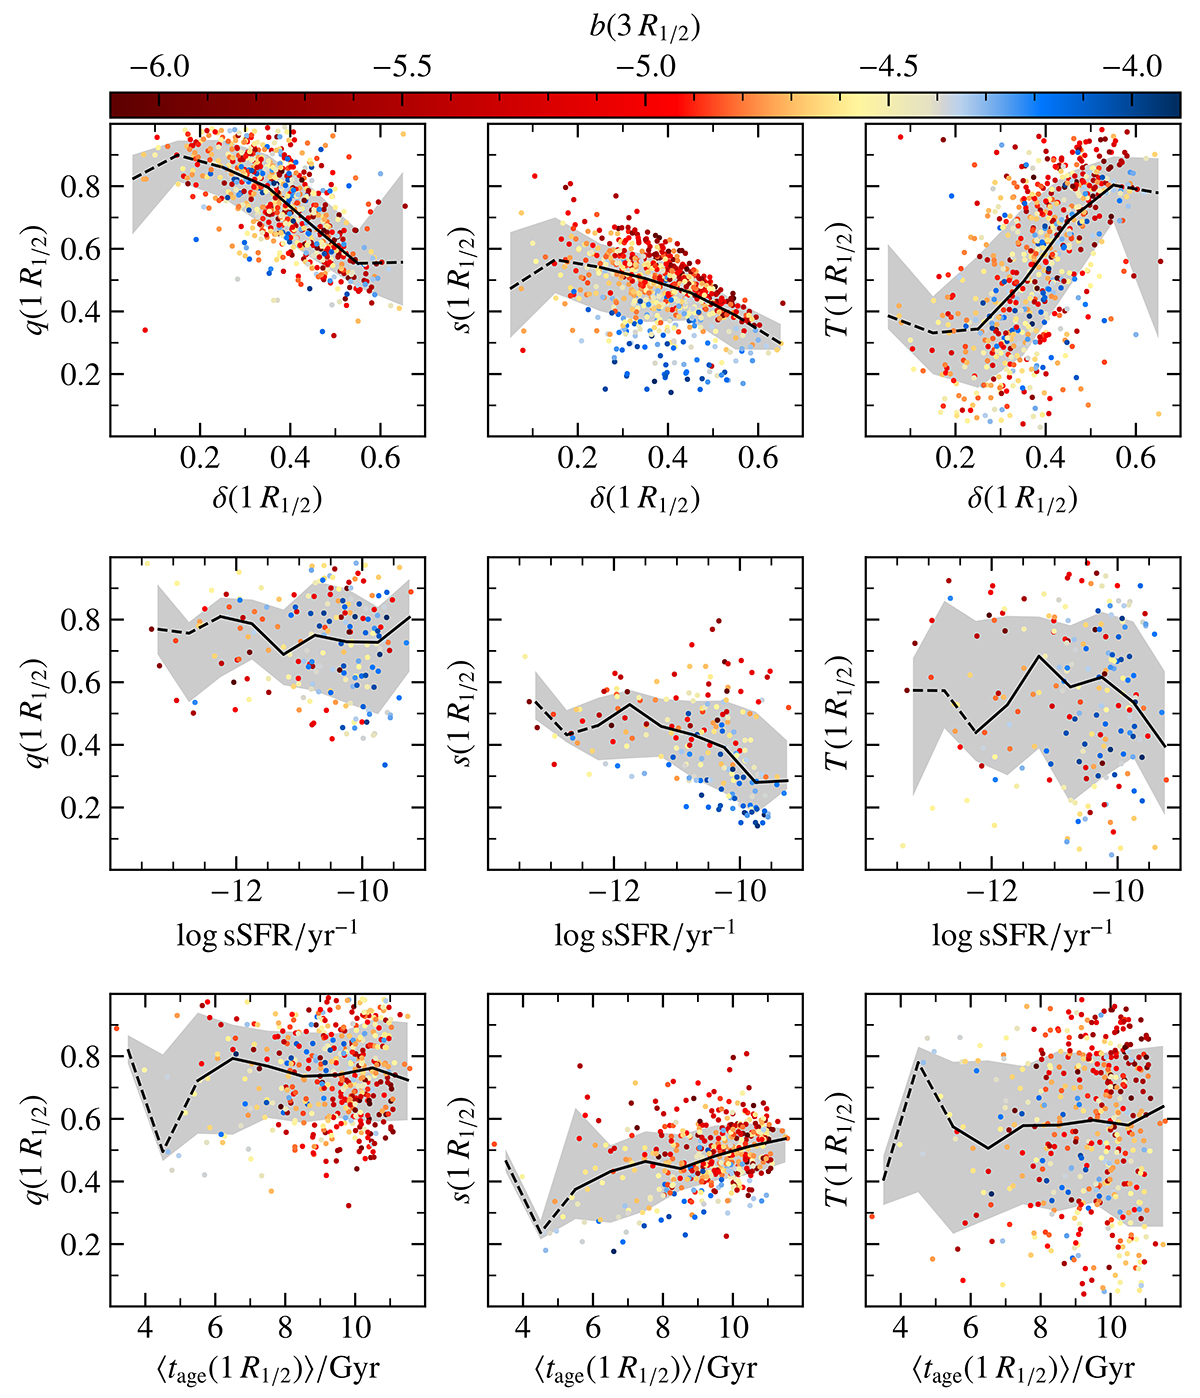
Relation between shape parameters q, s, and T at one stellar half-mass radius and different stellar properties found within the half-mass radius, colored by the b-value. Top row: Anisotropy of the stellar component within 1 R1/2. Middle row: Specific star formation rate within 1 R1/2. Only galaxies with non-zero star formation in their centers are plotted. Bottom row: Mass-weighted average age of the stars within 1 R1/2. The black lines indicate the median values in the respective bins and the shaded regions the 1σ ranges (containing 68% of the galaxies above and below the median).
Current usage metrics show cumulative count of Article Views (full-text article views including HTML views, PDF and ePub downloads, according to the available data) and Abstracts Views on Vision4Press platform.
Data correspond to usage on the plateform after 2015. The current usage metrics is available 48-96 hours after online publication and is updated daily on week days.
Initial download of the metrics may take a while.