Fig. 13.
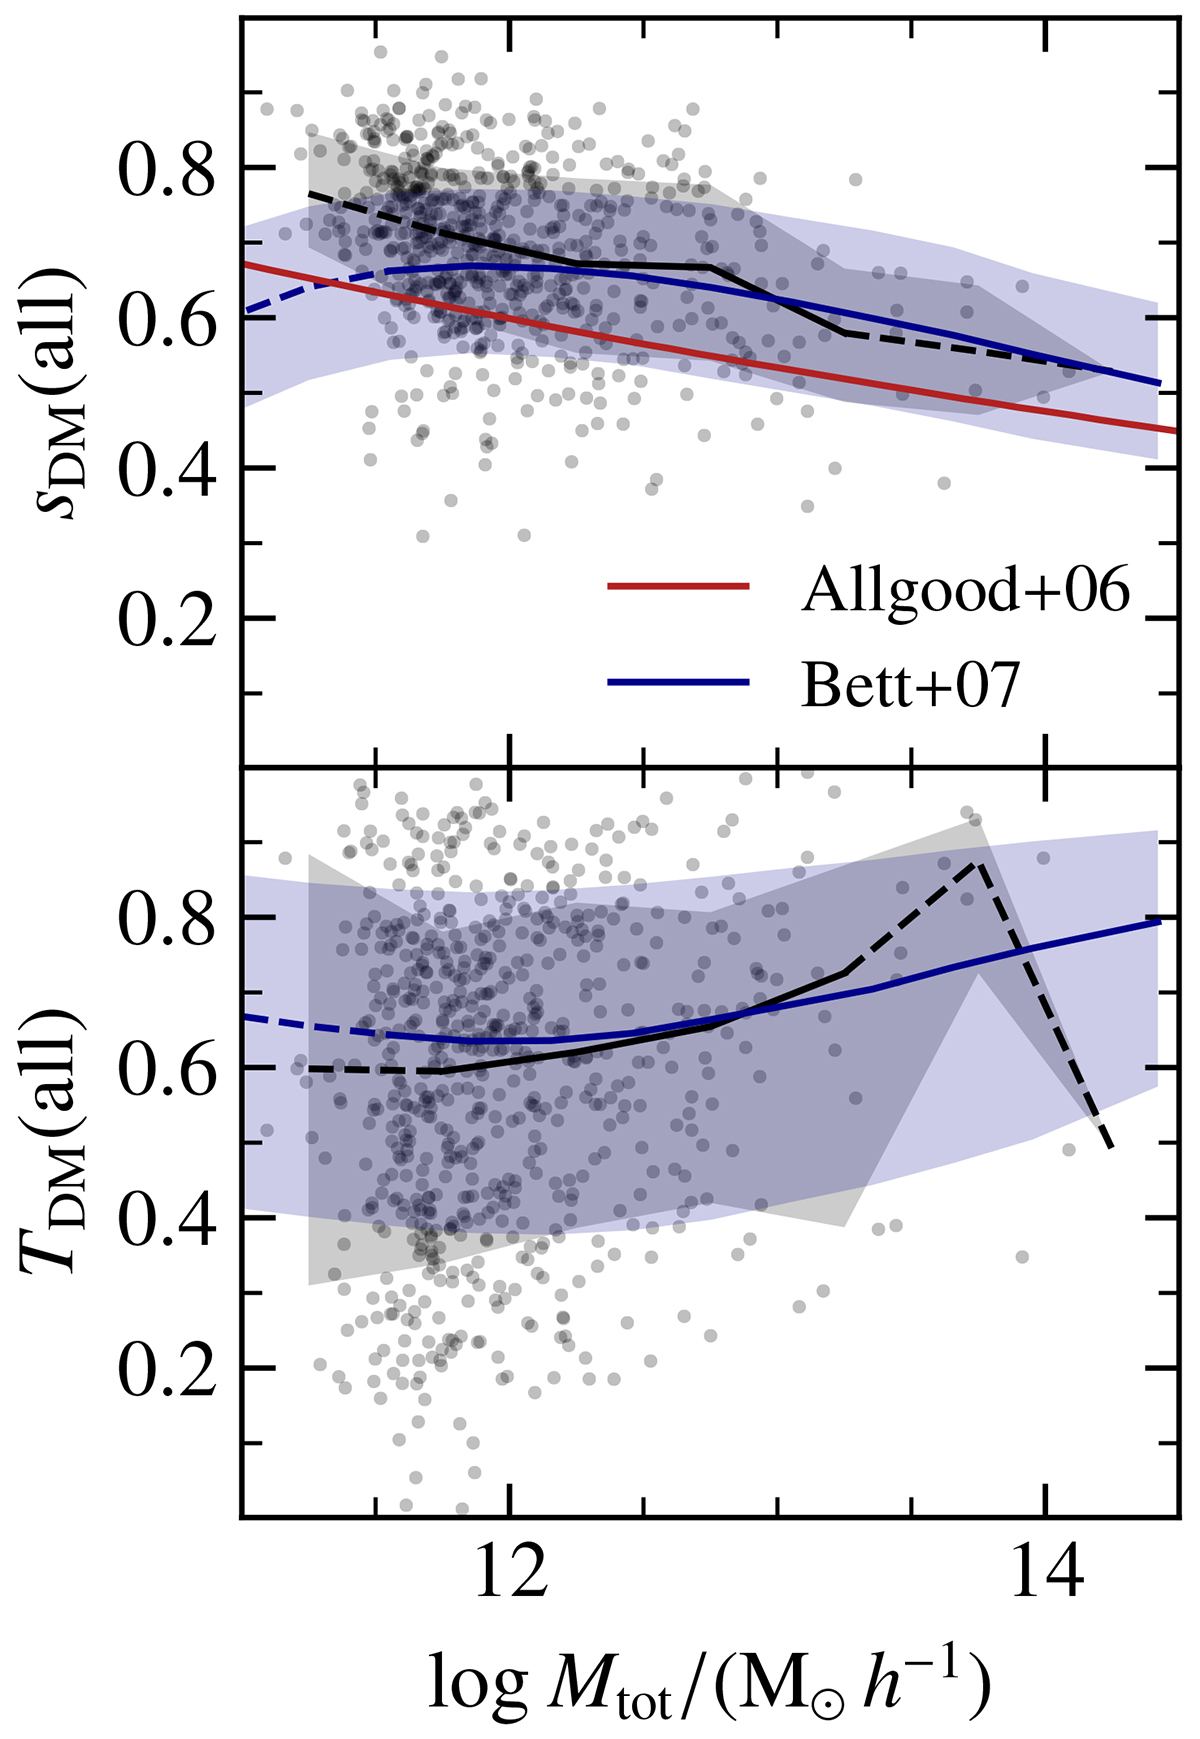
Download original image
Relation between the total mass and the full DM halo shape parameters, sDM and TDM, for the Magneticum sample used in this work (black), a set of six DM-only simulations (red, Allgood et al. 2006), and the Millennium simulation (blue, Bett et al. 2007). The solid lines indicate the median values in the respective mass bins and the shaded regions the 1σ ranges (containing 68% of the galaxies above and below the median). The blue dashed lines mark the halo masses corresponding to less than 300 DM particles in the Millenium simulation. The dashed part of the black lines indicates where there may be effects caused by low number statistics.
Current usage metrics show cumulative count of Article Views (full-text article views including HTML views, PDF and ePub downloads, according to the available data) and Abstracts Views on Vision4Press platform.
Data correspond to usage on the plateform after 2015. The current usage metrics is available 48-96 hours after online publication and is updated daily on week days.
Initial download of the metrics may take a while.