Fig. 9
Download original image
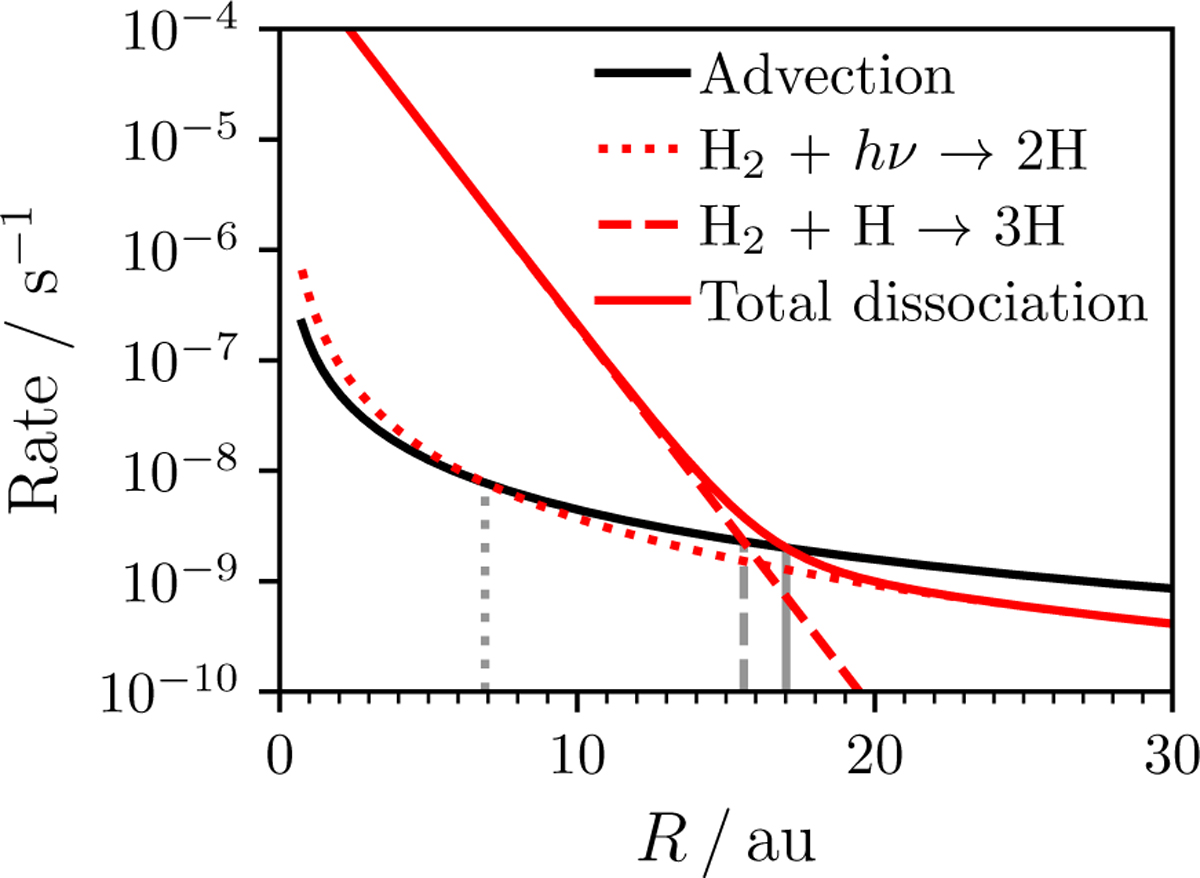
Rates (per H2 molecule) at which H2 is supplied to the wind by advection (black), H2 is photodissociated (red, dotted), and H2 is thermally dissociated by H (red, dashed). The solid red line represents the total dissociation rate given by the sum of the other two, while the vertical grey lines mark the position where H2 survives against each dissociation rate.
Current usage metrics show cumulative count of Article Views (full-text article views including HTML views, PDF and ePub downloads, according to the available data) and Abstracts Views on Vision4Press platform.
Data correspond to usage on the plateform after 2015. The current usage metrics is available 48-96 hours after online publication and is updated daily on week days.
Initial download of the metrics may take a while.