Fig. 6
Download original image
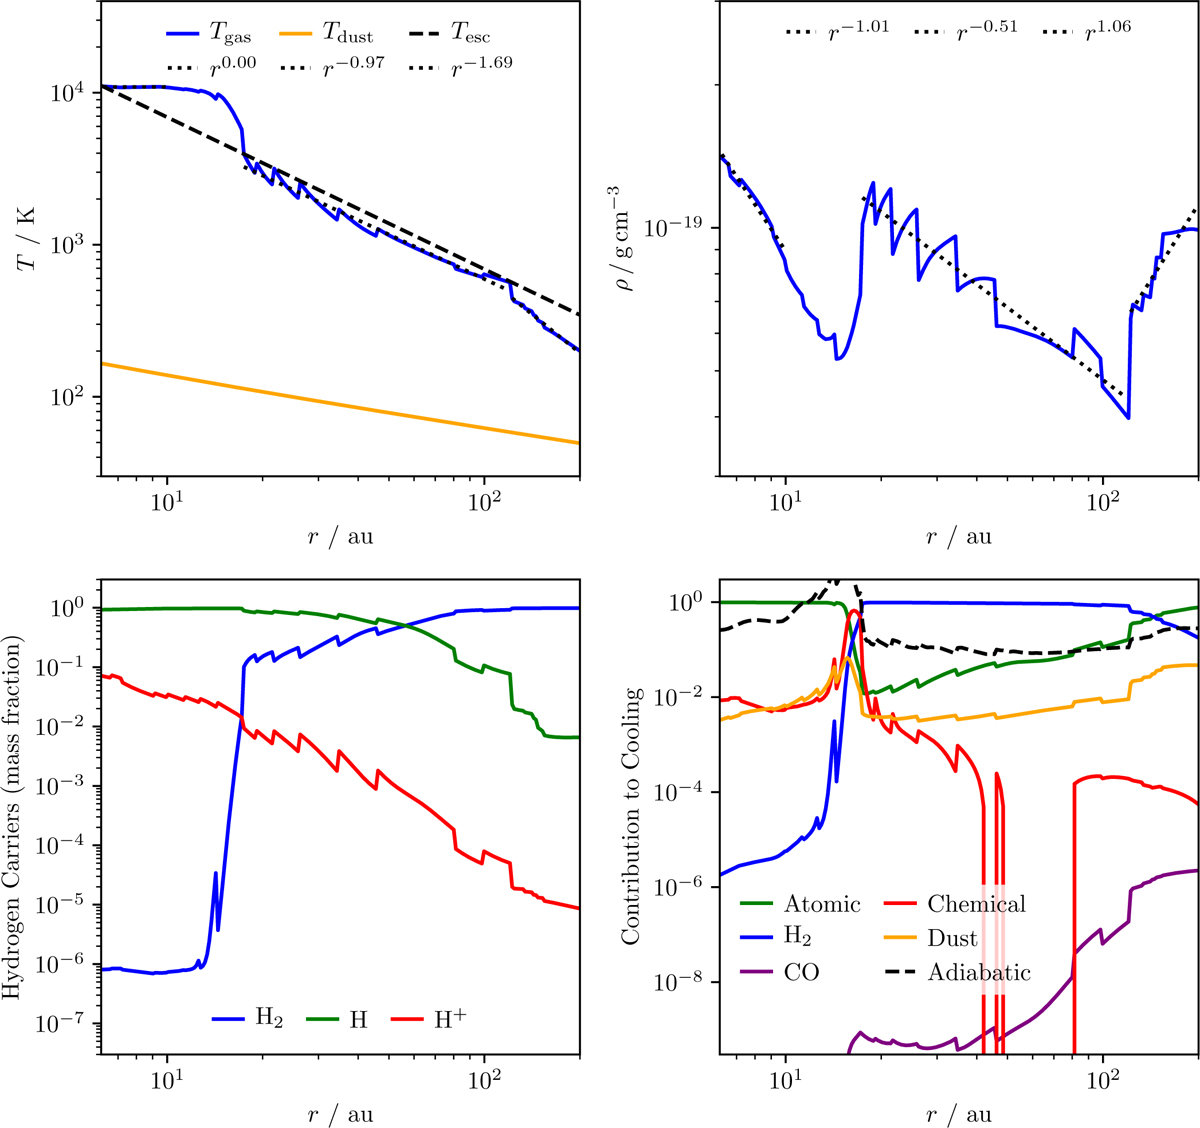
Quantities extracted along the sonic surface. We only show r > 6 au (where r is the spherical radius) since there is no coherent transsonic flow interior to 6 au. Top left: the gas (blue) and dust (orange) temperatures. For reference the dashed line shows the escape temperature of Owen et al. (2012) and the dotted lines are fits to the hot isothermal section, molecular section and outer section. Top right: the gas density, with fits to the same sections. Bottom left: the proportion of H in H+ (red), H (green) and H2 (blue). Bottom right: the fraction of the thermochemical cooling given by each major category of cooling.
Current usage metrics show cumulative count of Article Views (full-text article views including HTML views, PDF and ePub downloads, according to the available data) and Abstracts Views on Vision4Press platform.
Data correspond to usage on the plateform after 2015. The current usage metrics is available 48-96 hours after online publication and is updated daily on week days.
Initial download of the metrics may take a while.