Fig. 5
Download original image
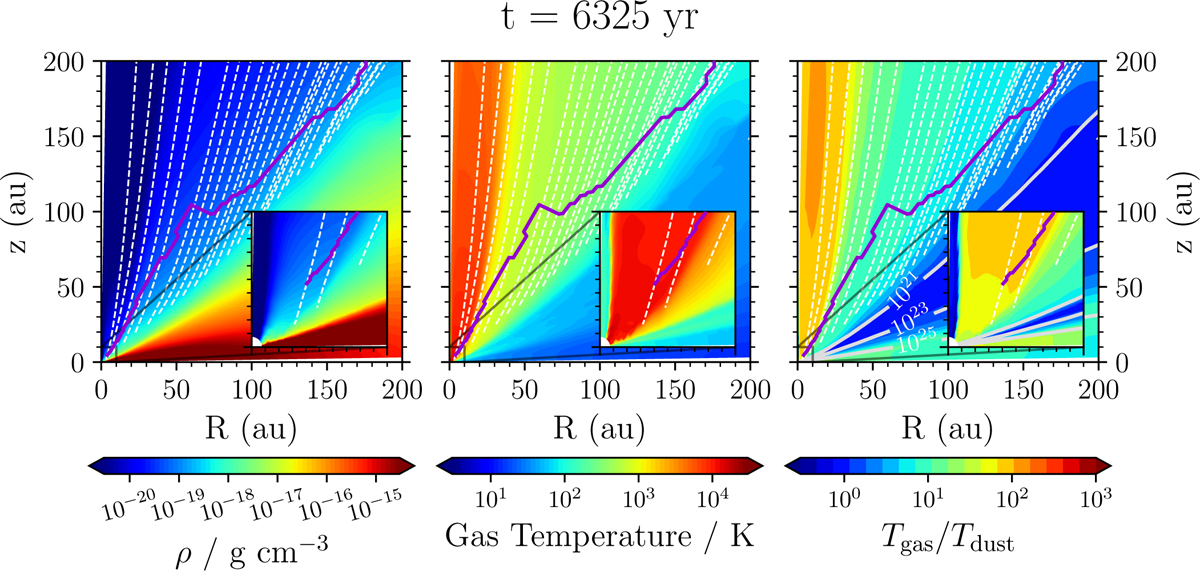
Gas density (left), gas temperature (centre), and ratio of gas and dust temperatures (right) after 200 orbits of the fiducial simulation. The latter is defined as min(Tgas,PRIZMO, TDIAD)/Tdust,PRIZMO. The solid purple line is the sonic surface, while the dashed lines show streamlines at regular intervals. The grey lines in the right-hand panel show total column densities of N = 1021, 1023, 1025 cm−2.
Current usage metrics show cumulative count of Article Views (full-text article views including HTML views, PDF and ePub downloads, according to the available data) and Abstracts Views on Vision4Press platform.
Data correspond to usage on the plateform after 2015. The current usage metrics is available 48-96 hours after online publication and is updated daily on week days.
Initial download of the metrics may take a while.