Fig. 11
Download original image
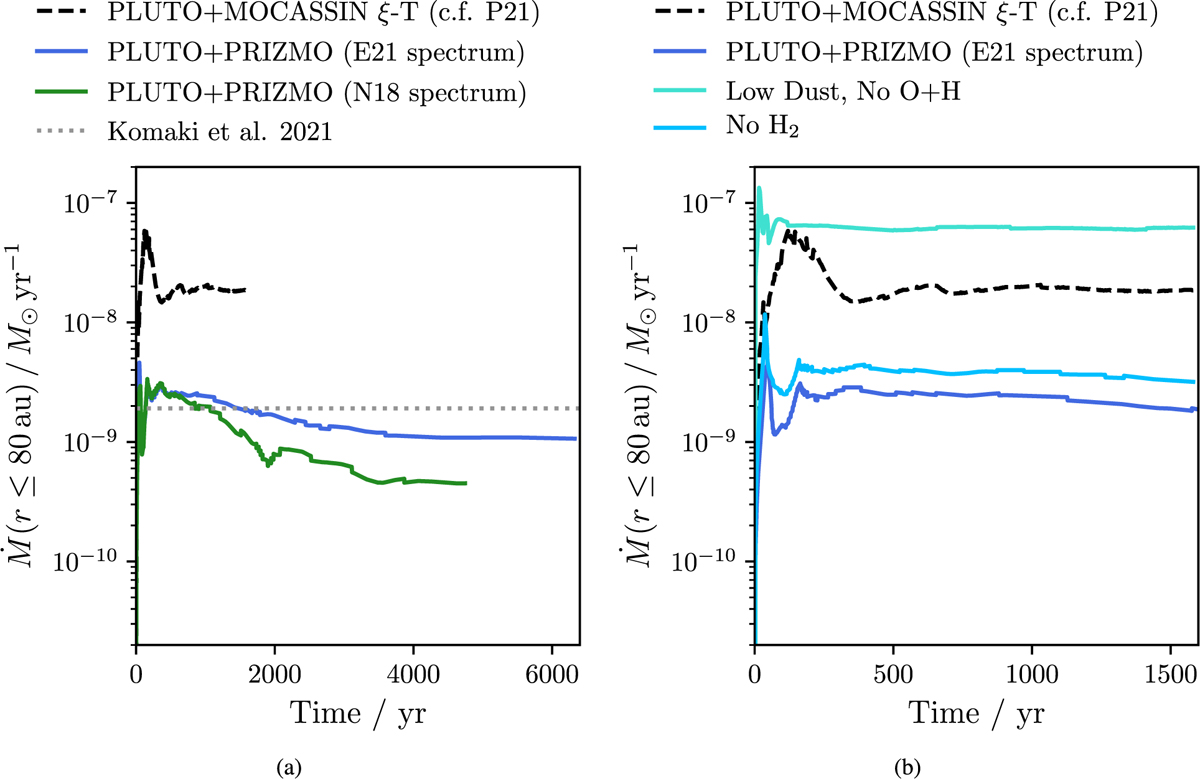
Evolution of the mass-loss rate inside 80 au calculated using PLUTO+PRIZMO. Panel a: Comparison between models using the X-ray spectrum of Ercolano et al. (2021, E21) (blue; 200 orbits at 10 au) and that of Nakatani et al. (2018b, N18) (green; 150 orbits at 10 au). For comparison, we also include 50 orbits of an analogue of the Picogna et al. (2021, P21) model (which uses a ξ − T relationship derived from MOCASSIN) as the black dashed line, and the value at 1 M⊙ from the fit to ![]() ) given in Komaki et al. (2021) as the grey dotted line. Panel b: Zoom-in on the first 50 orbits (at 10 au) of our fiducial simulation with the X-ray spectrum of Ercolano et al. (2021, E21) (dark blue) compared with models where we turn off the cooling due to collisions between O and H and include negligible dust (turquoise) or turn off the cooling due to H2 (light blue). For comparison, we again include 50 orbits of the Picogna et al. (2021, P21) analogue simulation as the black dashed line.
) given in Komaki et al. (2021) as the grey dotted line. Panel b: Zoom-in on the first 50 orbits (at 10 au) of our fiducial simulation with the X-ray spectrum of Ercolano et al. (2021, E21) (dark blue) compared with models where we turn off the cooling due to collisions between O and H and include negligible dust (turquoise) or turn off the cooling due to H2 (light blue). For comparison, we again include 50 orbits of the Picogna et al. (2021, P21) analogue simulation as the black dashed line.
Current usage metrics show cumulative count of Article Views (full-text article views including HTML views, PDF and ePub downloads, according to the available data) and Abstracts Views on Vision4Press platform.
Data correspond to usage on the plateform after 2015. The current usage metrics is available 48-96 hours after online publication and is updated daily on week days.
Initial download of the metrics may take a while.