Fig. 10
Download original image
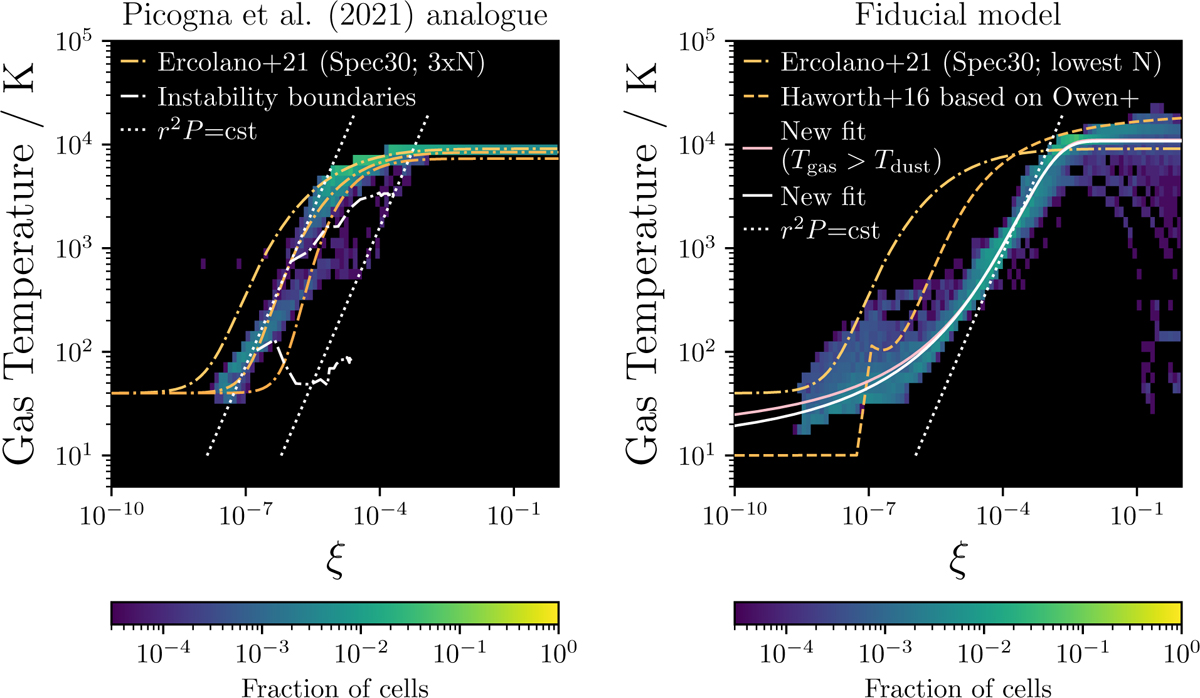
Distribution of cells in the plane of gas temperature T and ionisation parameter ξ for the Picogna et al. (2021) analogue model (left) and our fiducial model (right). We only show cells that are not fixed to the initial TDIAD. Overlaid are various parametrizations of the relationships between the variables: on the left, the yellow dash-dotted lines are the parametrizations for three different column densities from Ercolano et al. (2021); on the right, the yellow dash-dotted line is the lowest column density Ercolano et al. (2021) parametrization, the orange dashed line is from Haworth et al. (2016) and the white and pink solid lines are from this work. The other white lines delineate the unstable region in the Ercolano et al. (2021) prescription (dash-dotted) and lines of constant pressure at a given radius (dotted).
Current usage metrics show cumulative count of Article Views (full-text article views including HTML views, PDF and ePub downloads, according to the available data) and Abstracts Views on Vision4Press platform.
Data correspond to usage on the plateform after 2015. The current usage metrics is available 48-96 hours after online publication and is updated daily on week days.
Initial download of the metrics may take a while.