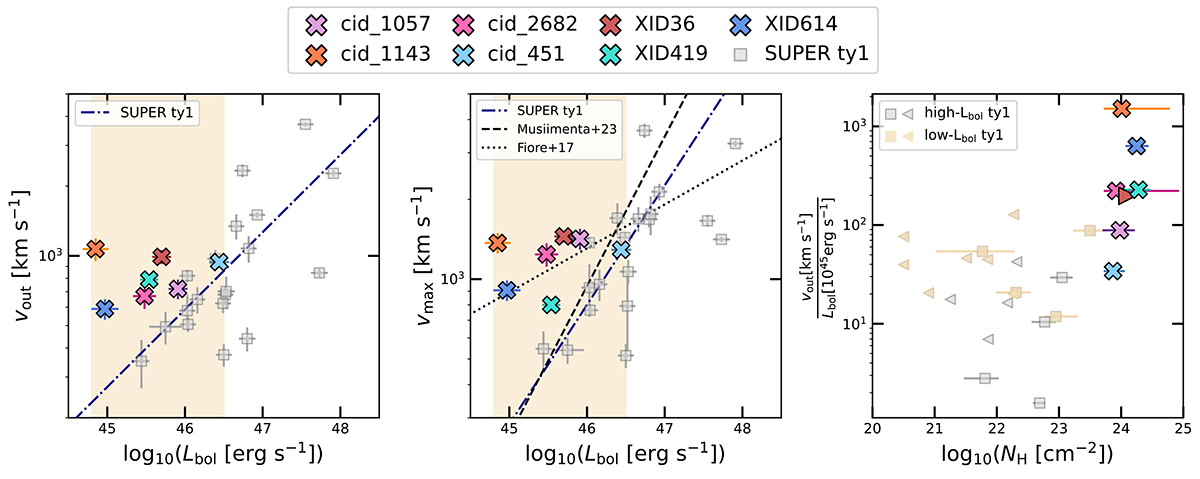
Fig. 8.
Download original image
Outflow velocities vout and vmax (left and middle panels) as a function of Lbol, and vout/Lbol ratios vs. X-ray NH measurements (right panel). The coloured crosses and grey squares represent SUPER type-2 and type-1 AGN, and the triangles in the right panel indicate upper and lower limits to NH. The dash-dotted blue lines represent our best-fit linear relation to the type-1 measurements, from which the type-2 points depart increasingly at decreasing Lbol (the mean deviation is 0.4dex). In the middle panel, we draw the empirical relation by Fiore et al. (2017) for comparison (dotted line), along with a more recent version from Musiimenta et al. (2023) (dashed). The orange shading in the left and middle panels marks the low-Lbol range (i.e. Lbol = 1044.8 − 46.5 erg s−1), where we compare the type-1 and type-2 AGN measurements. In the right panel, we consistently use light orange markers to identify type-1 AGN in the low-Lbol regime.
Current usage metrics show cumulative count of Article Views (full-text article views including HTML views, PDF and ePub downloads, according to the available data) and Abstracts Views on Vision4Press platform.
Data correspond to usage on the plateform after 2015. The current usage metrics is available 48-96 hours after online publication and is updated daily on week days.
Initial download of the metrics may take a while.