Fig. 4.
Download original image
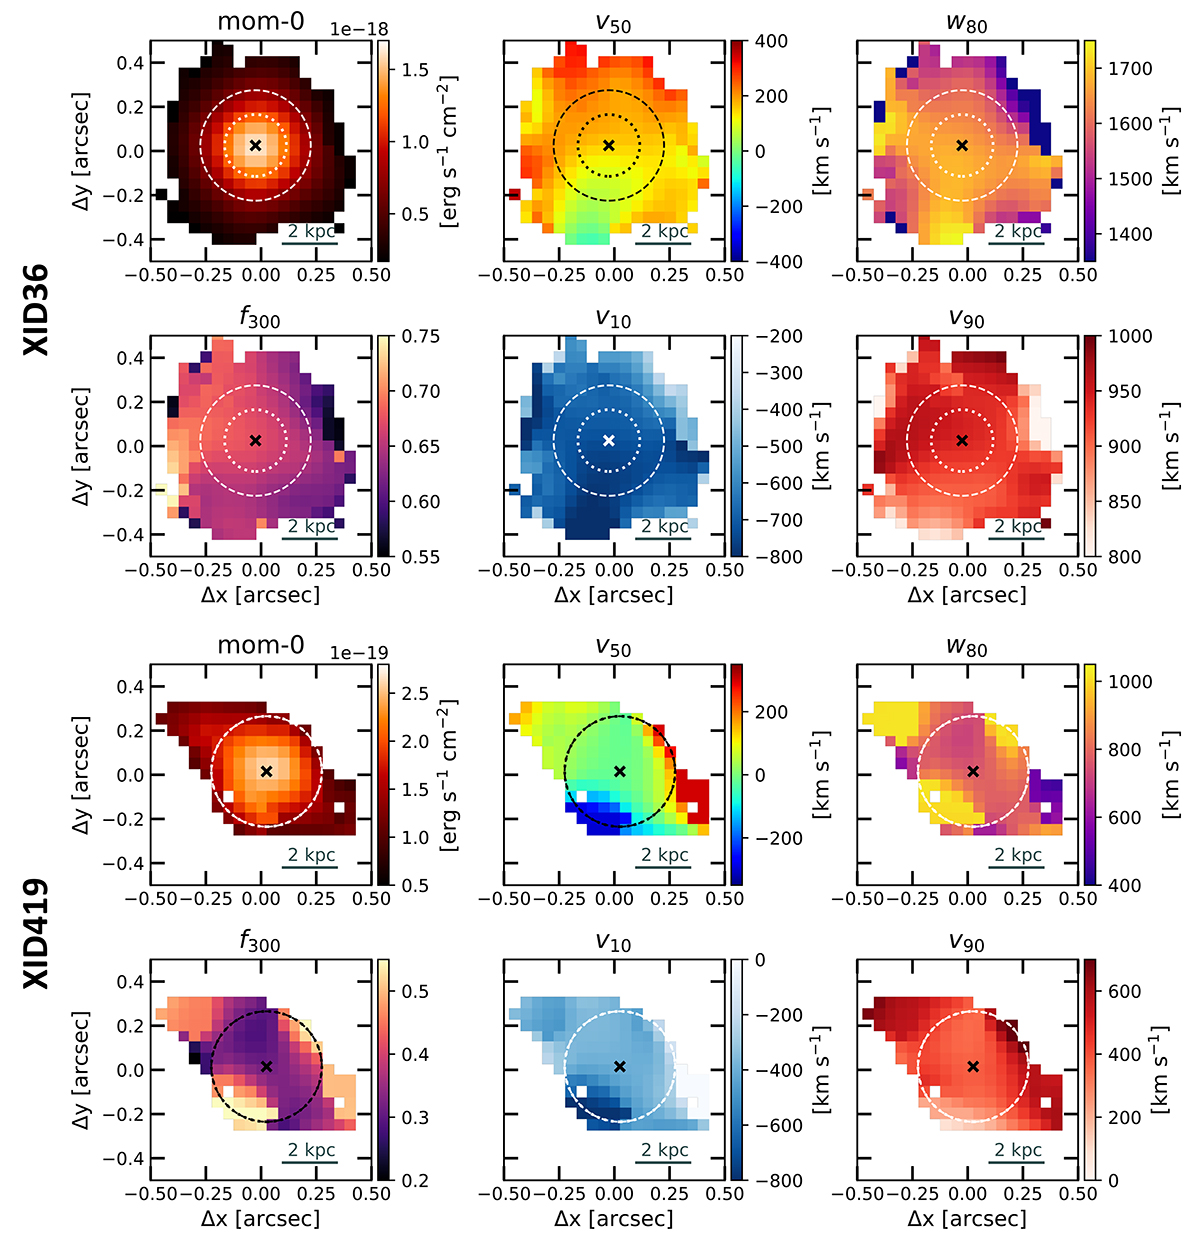
Morphology and kinematics of ionised gas in XID36 and XID419 as traced by the total [O III] line emission. For each target, the maps show the intensity (moment-0) field; the v50, v10, and v90 percentile velocities and the w80 line width; and the ratio f300 of the flux contained in [O III] wings (i.e. |v|> 300 km s−1) to the moment-0 flux. The dashed and dotted circles correspond to the radius aperture of 0.25″ we used to extract the integrated spectra (Sect. 3.2) and to the mean H-band PSF with a radius of ⟨θPSF⟩/2, respectively (see Table 2). The two circles have the same 0.25″ radius in XID419. In all maps, we apply an S/N > 3 cut and mark the position of the [O III] peak emission with a cross.
Current usage metrics show cumulative count of Article Views (full-text article views including HTML views, PDF and ePub downloads, according to the available data) and Abstracts Views on Vision4Press platform.
Data correspond to usage on the plateform after 2015. The current usage metrics is available 48-96 hours after online publication and is updated daily on week days.
Initial download of the metrics may take a while.