Fig. 3.
Download original image
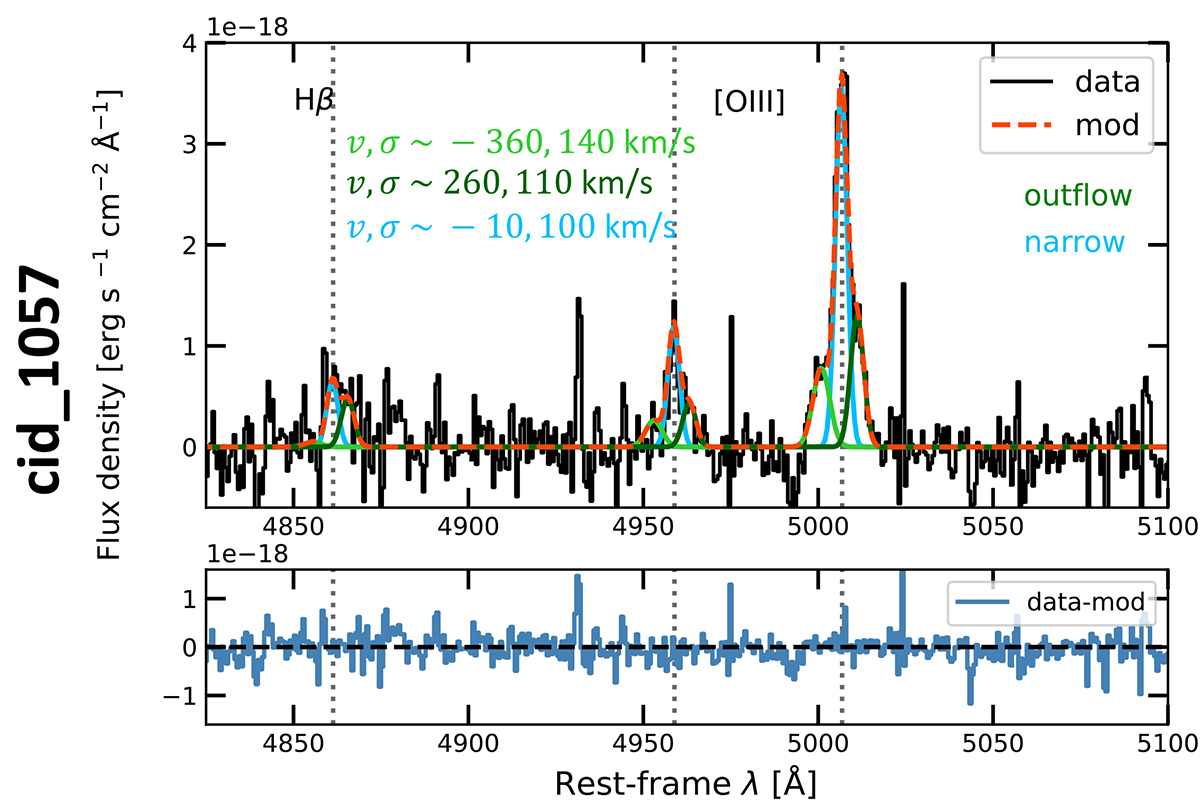
Integrated H-band spectrum of cid_1057, extracted from a SINFONI datacube with a radius aperture of 0.25″, after subtracting continuum emission that was modelled with a first-degree polynomial. Same as in Fig. 2. Three Gaussian components are used to properly model the [O III] line profile: One component was used for the systemic narrow line emission (light blue), and two components were used for the blue and red wings detected in [O III] (different greens).
Current usage metrics show cumulative count of Article Views (full-text article views including HTML views, PDF and ePub downloads, according to the available data) and Abstracts Views on Vision4Press platform.
Data correspond to usage on the plateform after 2015. The current usage metrics is available 48-96 hours after online publication and is updated daily on week days.
Initial download of the metrics may take a while.