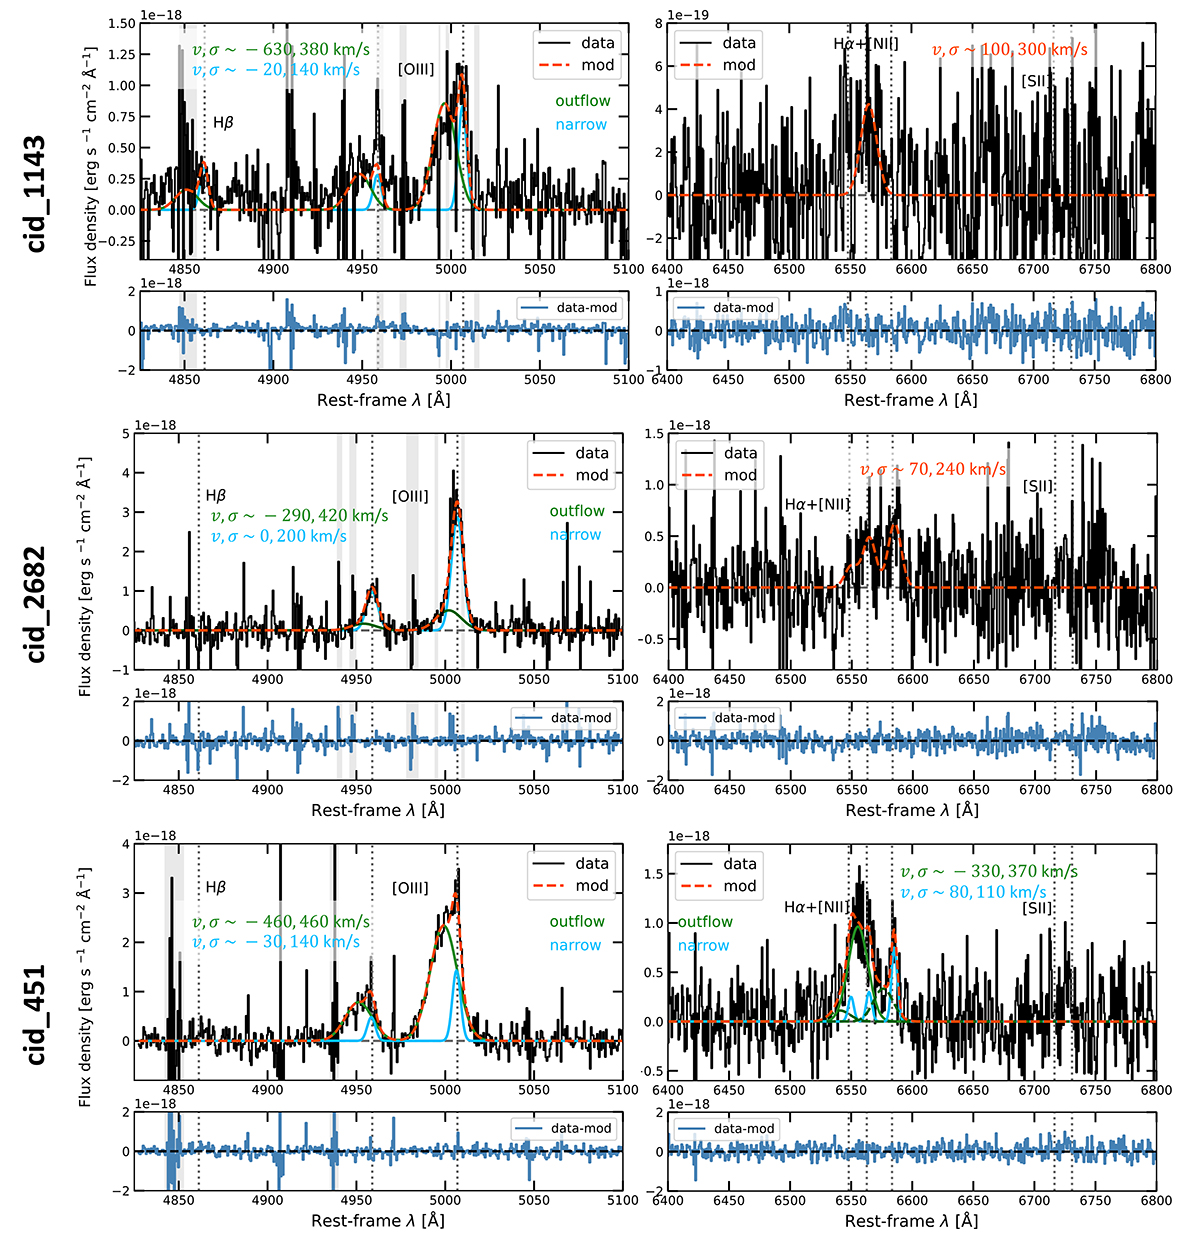
Fig. 2.
Download original image
Integrated H- and K-band spectra extracted from SINFONI datacubes of cid_1143 (top), cid_2682 (middle), and cid_451 (bottom), with a radius aperture of 0.25″, after subtracting continuum emission that was modelled with a first-degree polynomial. Same as in Fig. 2. In the K-band spectrum of cid_1143, we fit only the Hα line emission due to the low S/N (S/N < 2) of this dataset.
Current usage metrics show cumulative count of Article Views (full-text article views including HTML views, PDF and ePub downloads, according to the available data) and Abstracts Views on Vision4Press platform.
Data correspond to usage on the plateform after 2015. The current usage metrics is available 48-96 hours after online publication and is updated daily on week days.
Initial download of the metrics may take a while.