Fig. A.2.
Download original image
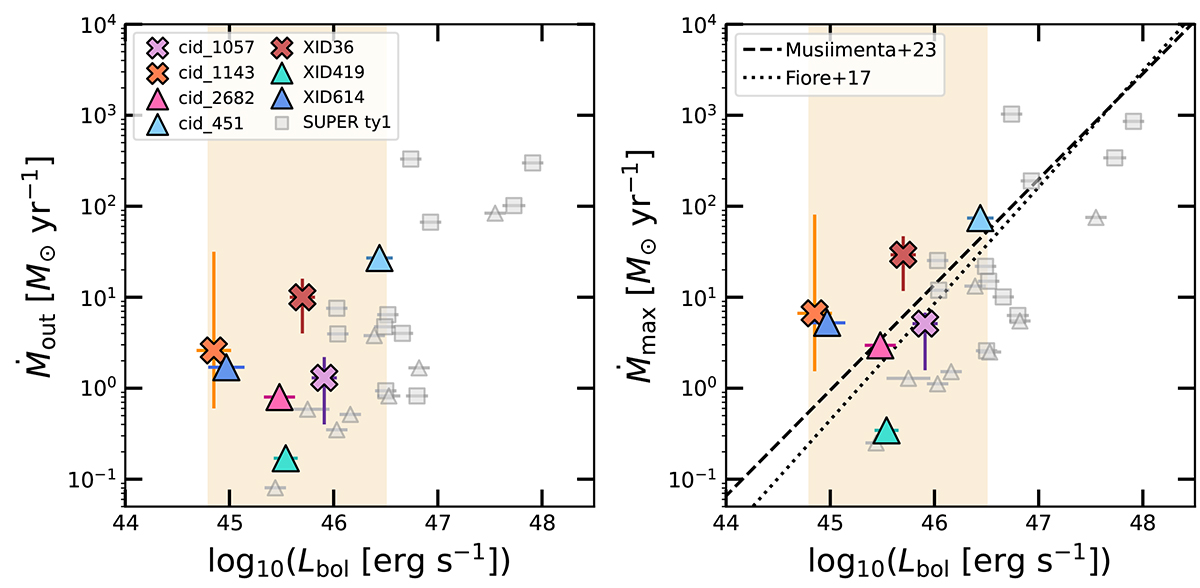
Outflow mass rates as a function of Lbol for the full SUPER sample. Upper and lower panels show our trust Ṁout values and Ṁmax mass rates, derived using vmax in Eq. 2. Triangles indicate lower limits to mass rates. In the lower panel, scaling relations from Fiore et al. (2017) and Musiimenta et al. (2023) are shown as dotted and dashed lines, after being re-scaled to ne = 500 adopted for our targets, while values of Ṁmax have been multiplied by a factor of 2 to match definitions adopted in Fiore et al. (2017) and Musiimenta et al. (2023). Compared to Fig. 8, the distribution of measurements is more scattered, with no clear discrepancy between the type-1 and type-2 samples. The comparison is furthermore hampered by the large number of lower limits to mass rates.
Current usage metrics show cumulative count of Article Views (full-text article views including HTML views, PDF and ePub downloads, according to the available data) and Abstracts Views on Vision4Press platform.
Data correspond to usage on the plateform after 2015. The current usage metrics is available 48-96 hours after online publication and is updated daily on week days.
Initial download of the metrics may take a while.