Fig. 1.
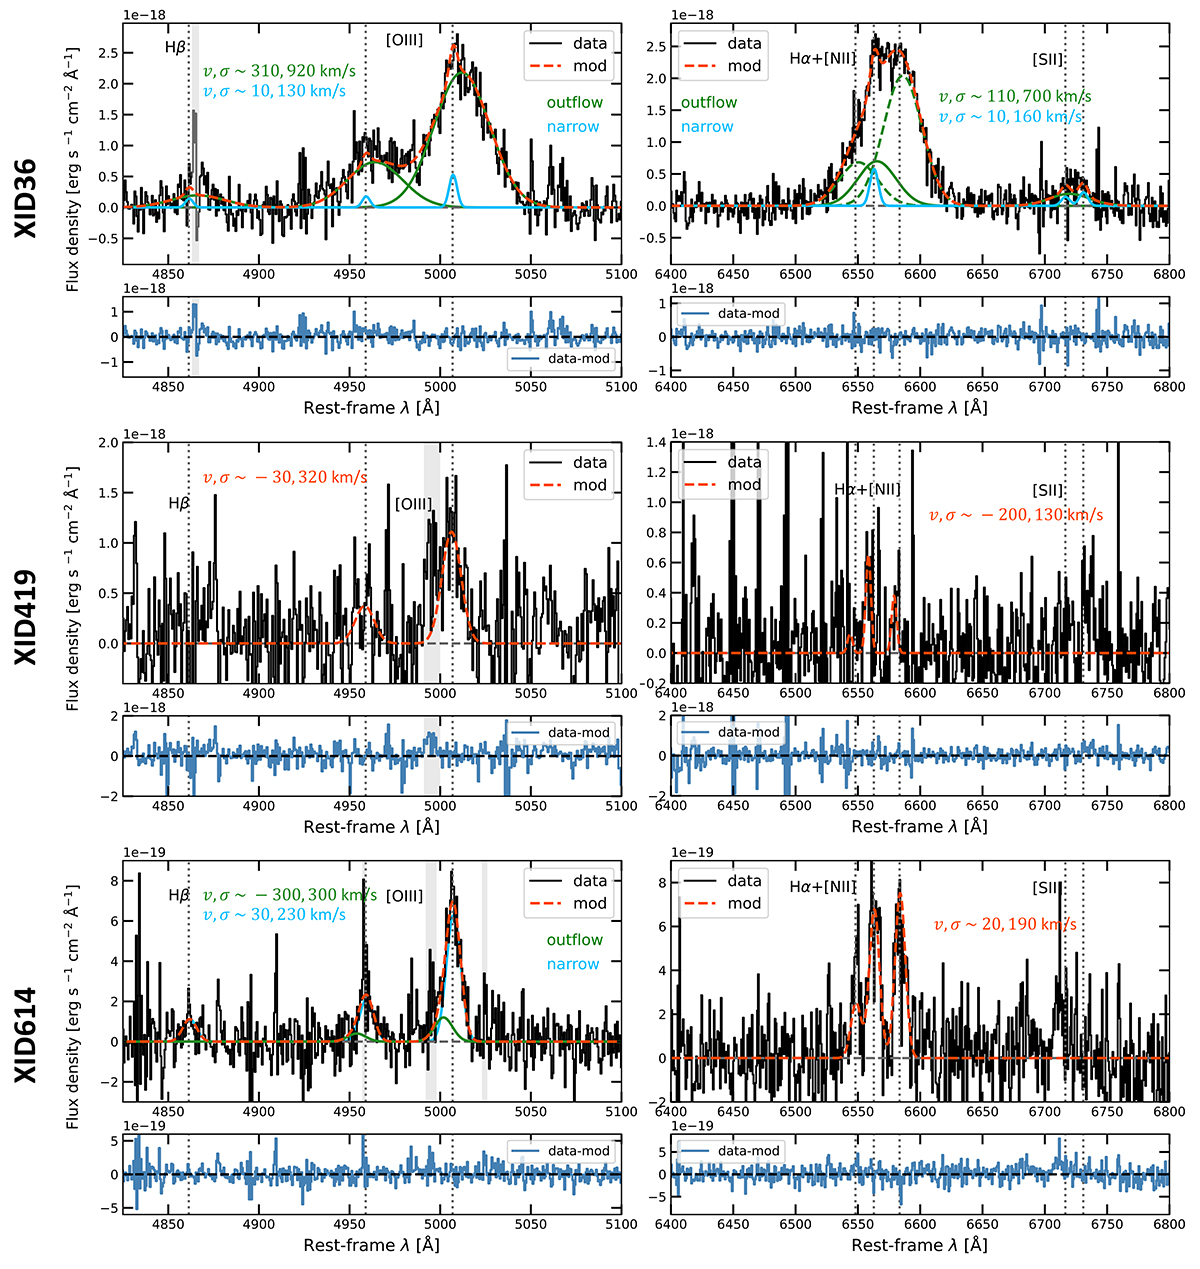
Download original image
Integrated H- and K-band spectra extracted from SINFONI datacubes of XID36 (top), XID419 (middle), and XID614 (bottom), with a radius aperture of 0.25″, after subtracting continuum emission that was modelled with a first-degree polynomial. The data are shown in black, and the total emission-line model is overplotted in red. For multi-Gaussian modellings, we separately plot the narrow systemic (light blue) and broad high-velocity components (green) that are associated with outflows. In the top right panel, the solid and dashed green lines represent the outflow component of Hα and [N II] doublet, respectively. The mean velocity v and the velocity dispersion σ values of each Gaussian component are displayed. The shaded grey regions indicate masked channels that are contaminated by sky line residuals, and the vertical dotted lines mark the rest-frame emission line wavelengths at the redshift of each source, as computed in Sect. 3.1. Below each main panel, a second panel shows the corresponding residuals (i.e. data–model).
Current usage metrics show cumulative count of Article Views (full-text article views including HTML views, PDF and ePub downloads, according to the available data) and Abstracts Views on Vision4Press platform.
Data correspond to usage on the plateform after 2015. The current usage metrics is available 48-96 hours after online publication and is updated daily on week days.
Initial download of the metrics may take a while.