Fig. 9.
Download original image
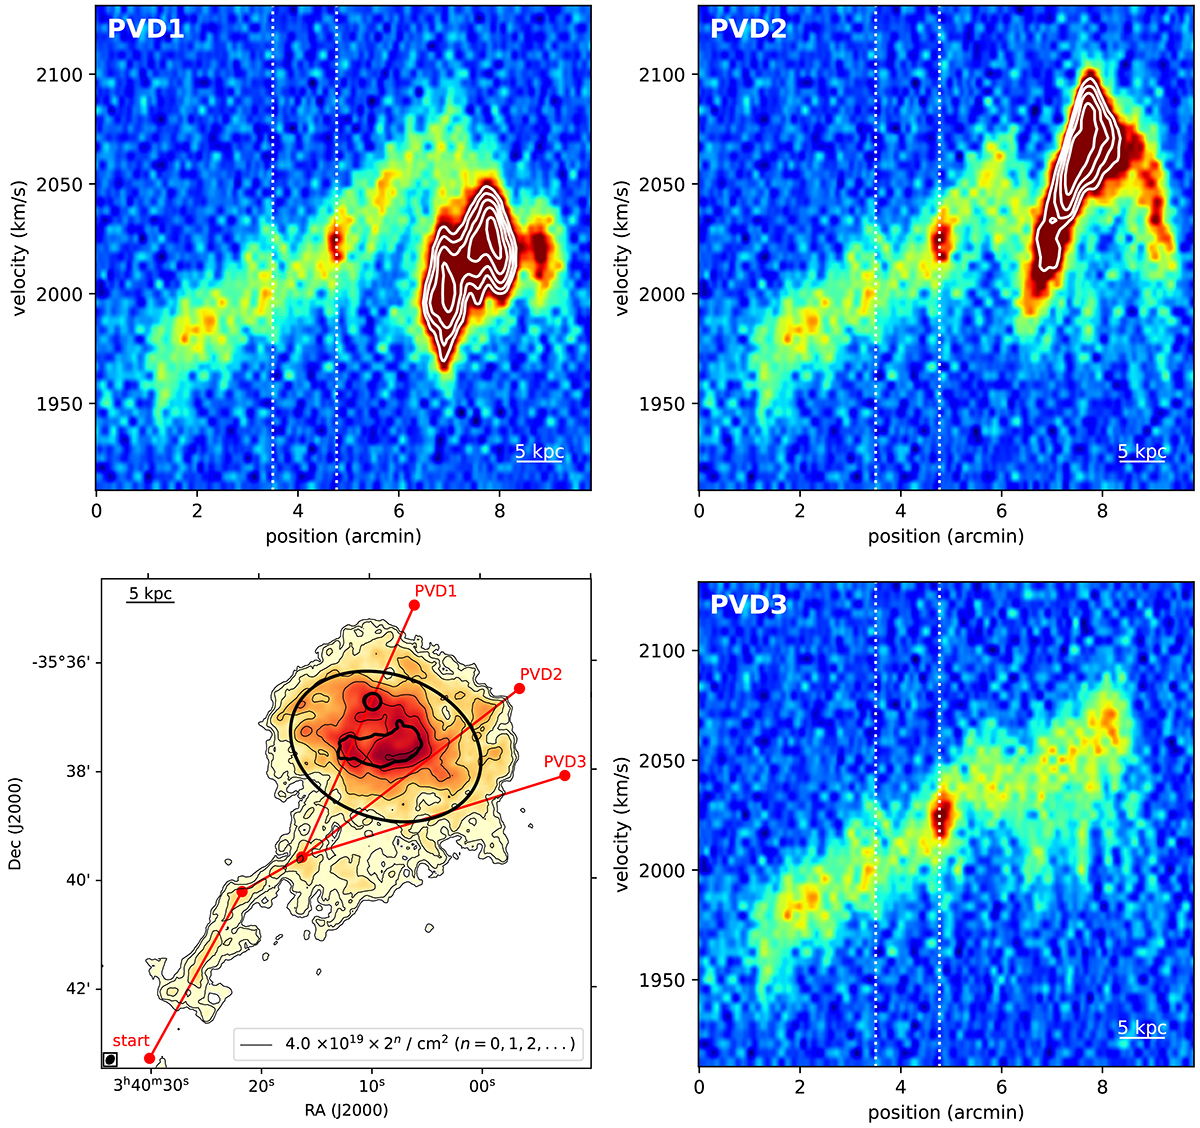
H I position-velocity diagrams along the three paths shown in red in the bottom-left panel. The diagrams are drawn using a width of ∼20″, twice the 11″ angular resolution of the H I cube used here. For visualisation purpose we binned the channels by a factor of 3 compared to the specs given in Sect. 2, resulting in a channel width of 4.1 km s−1. The three diagrams begin from the point labelled as “start” in the bottom-left panel and have a common first half, which consists of two straight segments. The end of these two segments is represented by the vertical dashed lines in the diagrams. The linear colour-scale of the diagrams ranges from −2σ to +8σ, where σ is the noise level. The white contours start at a +10σ level and increase by a factor ![]() at each step. The colour-scale and contours of the bottom-left panel are as in Fig. 3.
at each step. The colour-scale and contours of the bottom-left panel are as in Fig. 3.
Current usage metrics show cumulative count of Article Views (full-text article views including HTML views, PDF and ePub downloads, according to the available data) and Abstracts Views on Vision4Press platform.
Data correspond to usage on the plateform after 2015. The current usage metrics is available 48-96 hours after online publication and is updated daily on week days.
Initial download of the metrics may take a while.