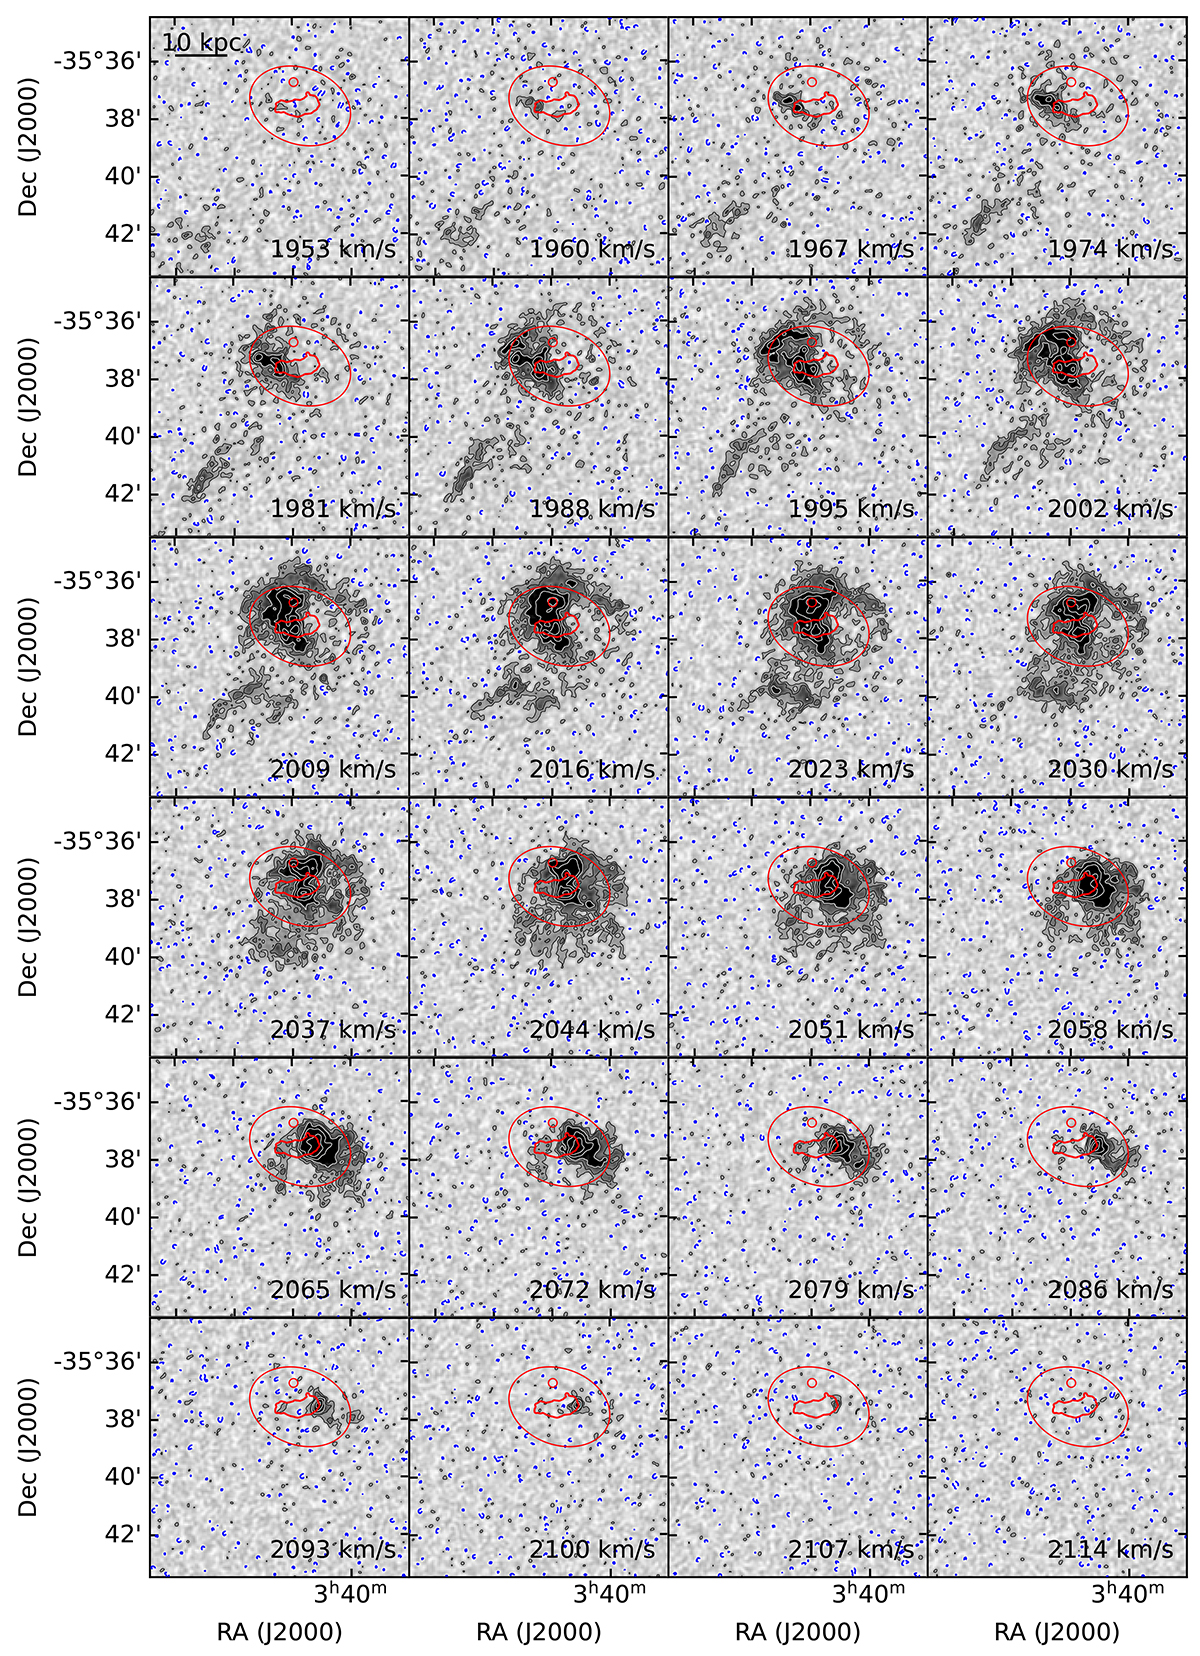
Fig. 8.
Download original image
Channel maps of the 11″-resolution H I cube of NGC 1427A. For visualisation purpose we binned the channels by a factor of 5 compared to the specs given in Sect. 2, resulting in a channel width of 6.9 km s−1. We use a linear grey scale from −2σ to +10σ, where σ is the noise level. The blue contour represents emission at −2σ. The black contours represent emission at 2 and 4σ. The white contours represent emission at 8, 16, 32, and 64σ. The red contours show the main features of the optical image (Fig. 1).
Current usage metrics show cumulative count of Article Views (full-text article views including HTML views, PDF and ePub downloads, according to the available data) and Abstracts Views on Vision4Press platform.
Data correspond to usage on the plateform after 2015. The current usage metrics is available 48-96 hours after online publication and is updated daily on week days.
Initial download of the metrics may take a while.