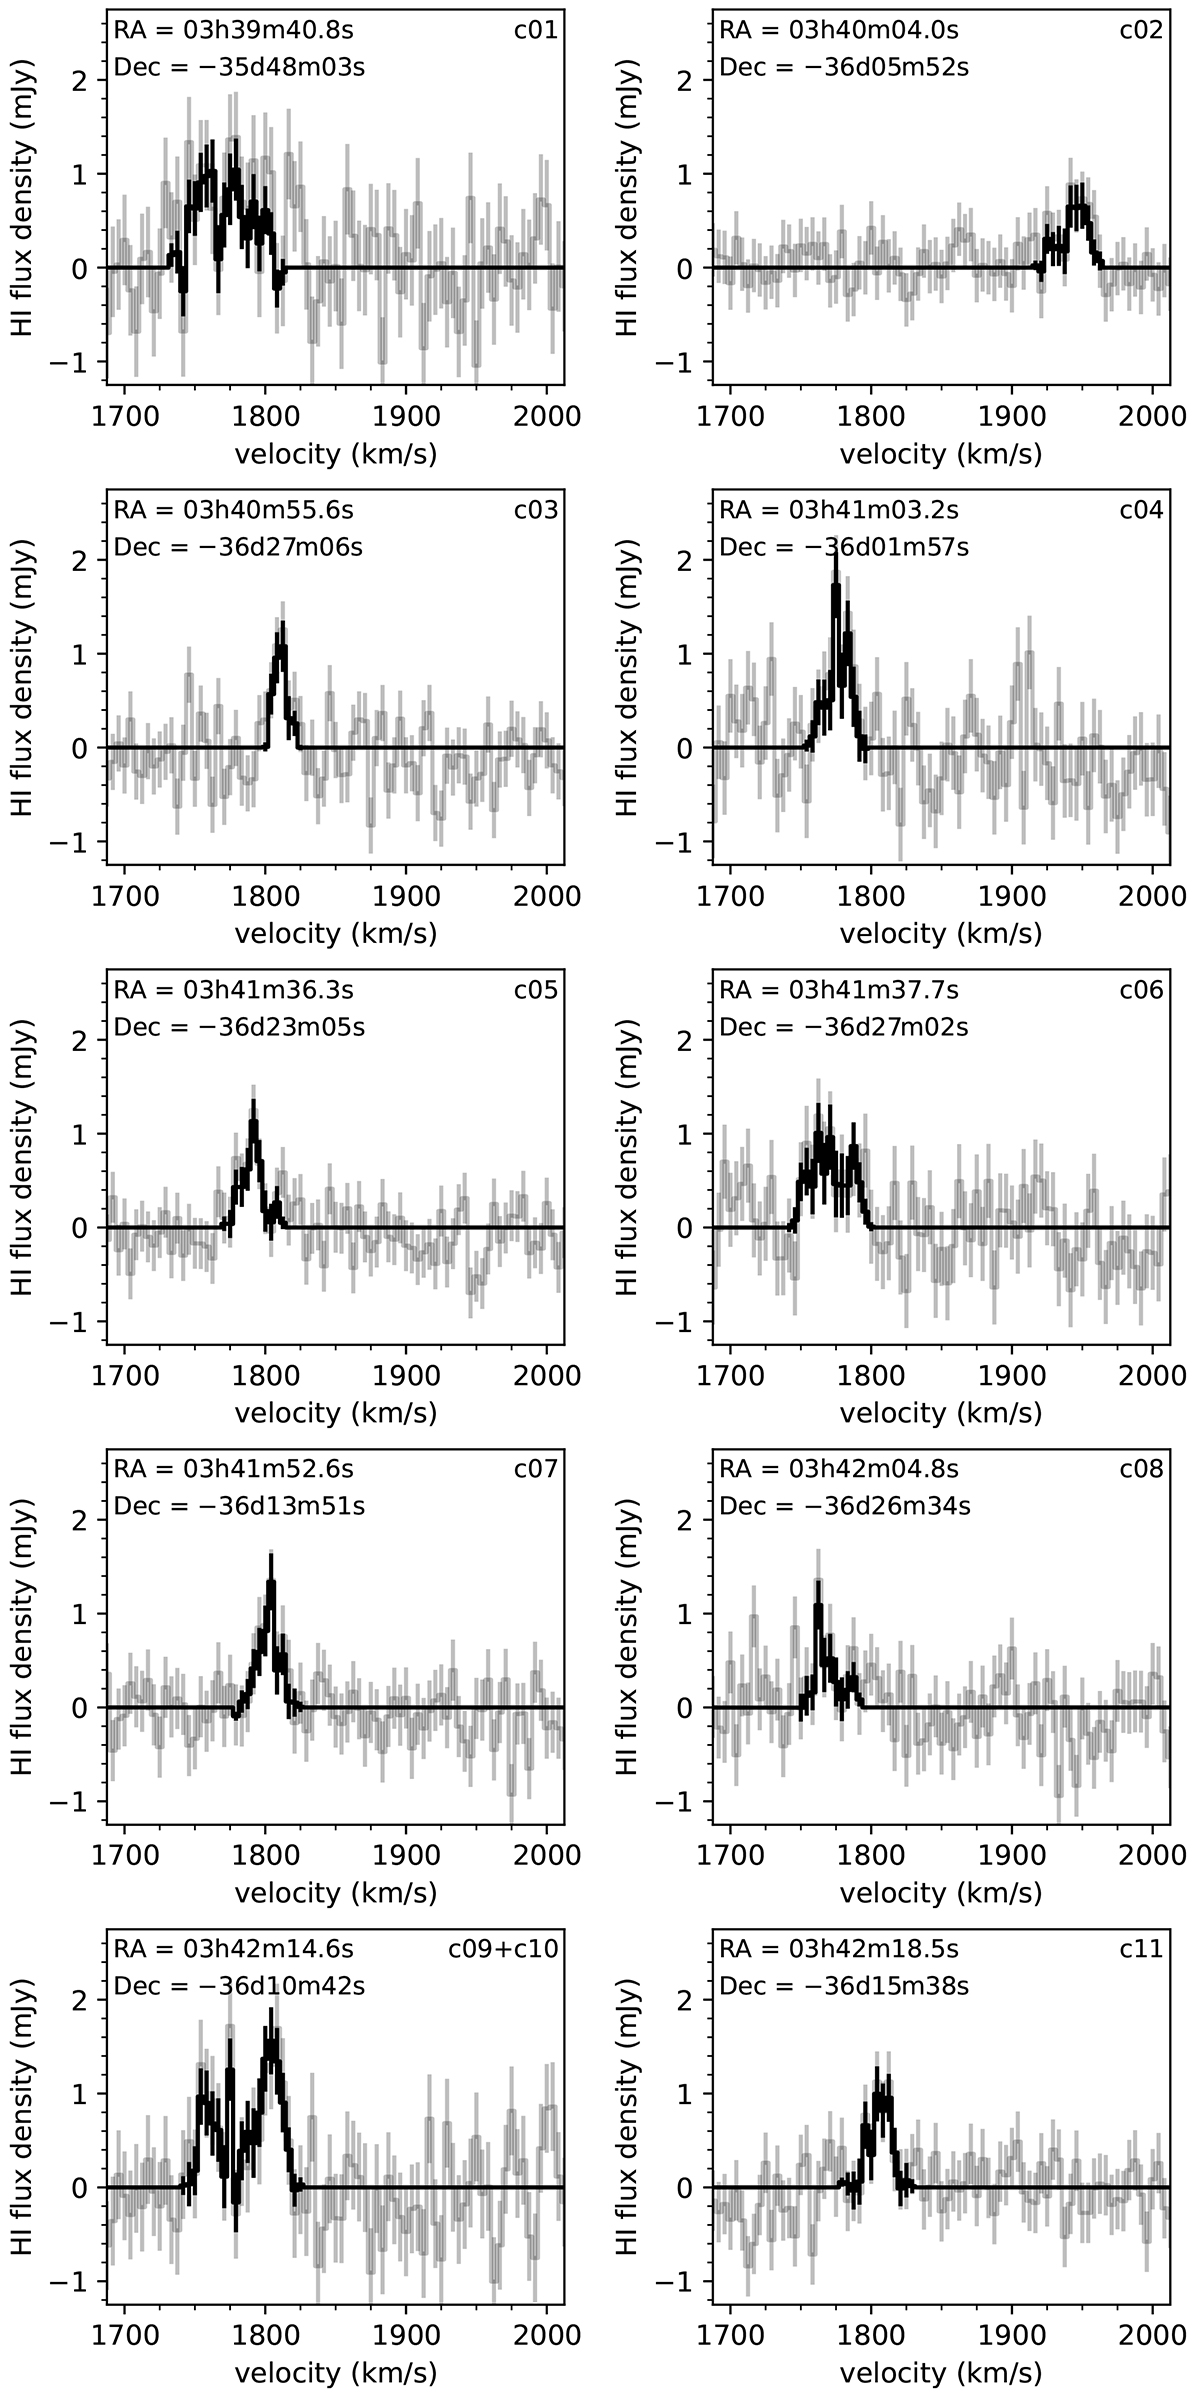
Fig. 6.
Download original image
Integrated H I spectrum of the ten clouds shown in Fig. 4 sorted in order of increasing RA (left to right, top to bottom) and using the same labels as in that figure. The spectra are obtained from the 66″-resolution cube and are binned by a factor of 3 along the spectral axis, resulting in a channel width of 4.1 km s−1. For each cloud, the black line shows the spectrum integrated within the 3D detection mask, while the grey line shows the spectrum integrated over a 2D aperture obtained collapsing the detection mask along the spectral axis. In both cases, we show statistical error bars based on the local noise level and on the number of spatial pixels included in the integral of each channel. We show the position of the H I centre of mass of each cloud in the top-left corner. The bottom-left panel shows two clouds that are blended in 3D.
Current usage metrics show cumulative count of Article Views (full-text article views including HTML views, PDF and ePub downloads, according to the available data) and Abstracts Views on Vision4Press platform.
Data correspond to usage on the plateform after 2015. The current usage metrics is available 48-96 hours after online publication and is updated daily on week days.
Initial download of the metrics may take a while.