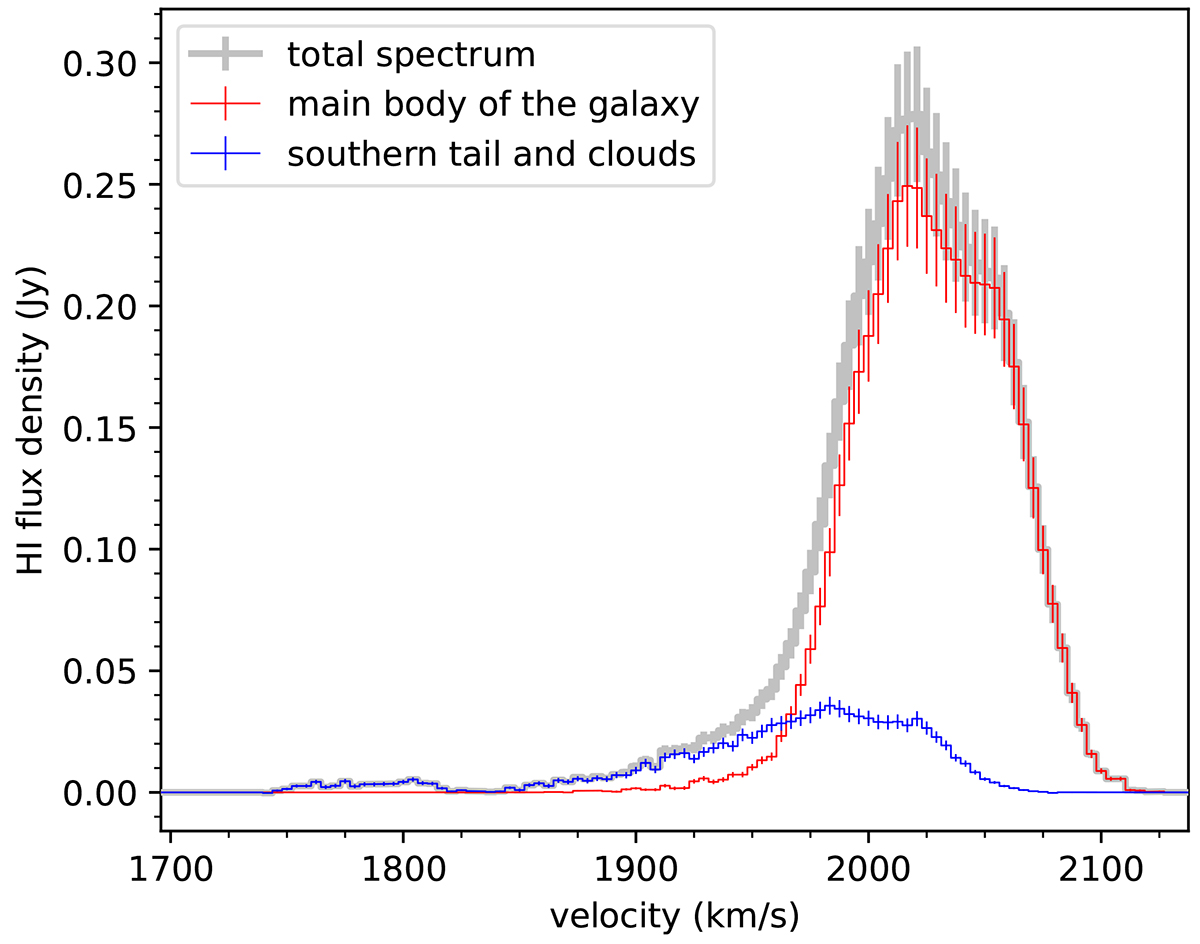
Fig. 5.

Download original image
H I spectrum of NGC 1427A obtained integrating the 66″-resolution cube within the detection mask and binning along the spectral axis by a factor of 3, resulting in a channel width of 4.1 km s−1. The error bars are the sum in quadrature of the statistical error (derived from the noise level of the cube and the number of spatial pixels included in the integral of each channel) and a 10% flux scale uncertainty (Serra et al. 2023). The spectrum is in good agreement with previously published spectra (Koribalski et al. 2004; Loni et al. 2021). We refer to the text for a description of the decomposition of the total spectrum (grey line) in two components (red and blue line, respectively).
Current usage metrics show cumulative count of Article Views (full-text article views including HTML views, PDF and ePub downloads, according to the available data) and Abstracts Views on Vision4Press platform.
Data correspond to usage on the plateform after 2015. The current usage metrics is available 48-96 hours after online publication and is updated daily on week days.
Initial download of the metrics may take a while.


