Fig. 2.
Download original image
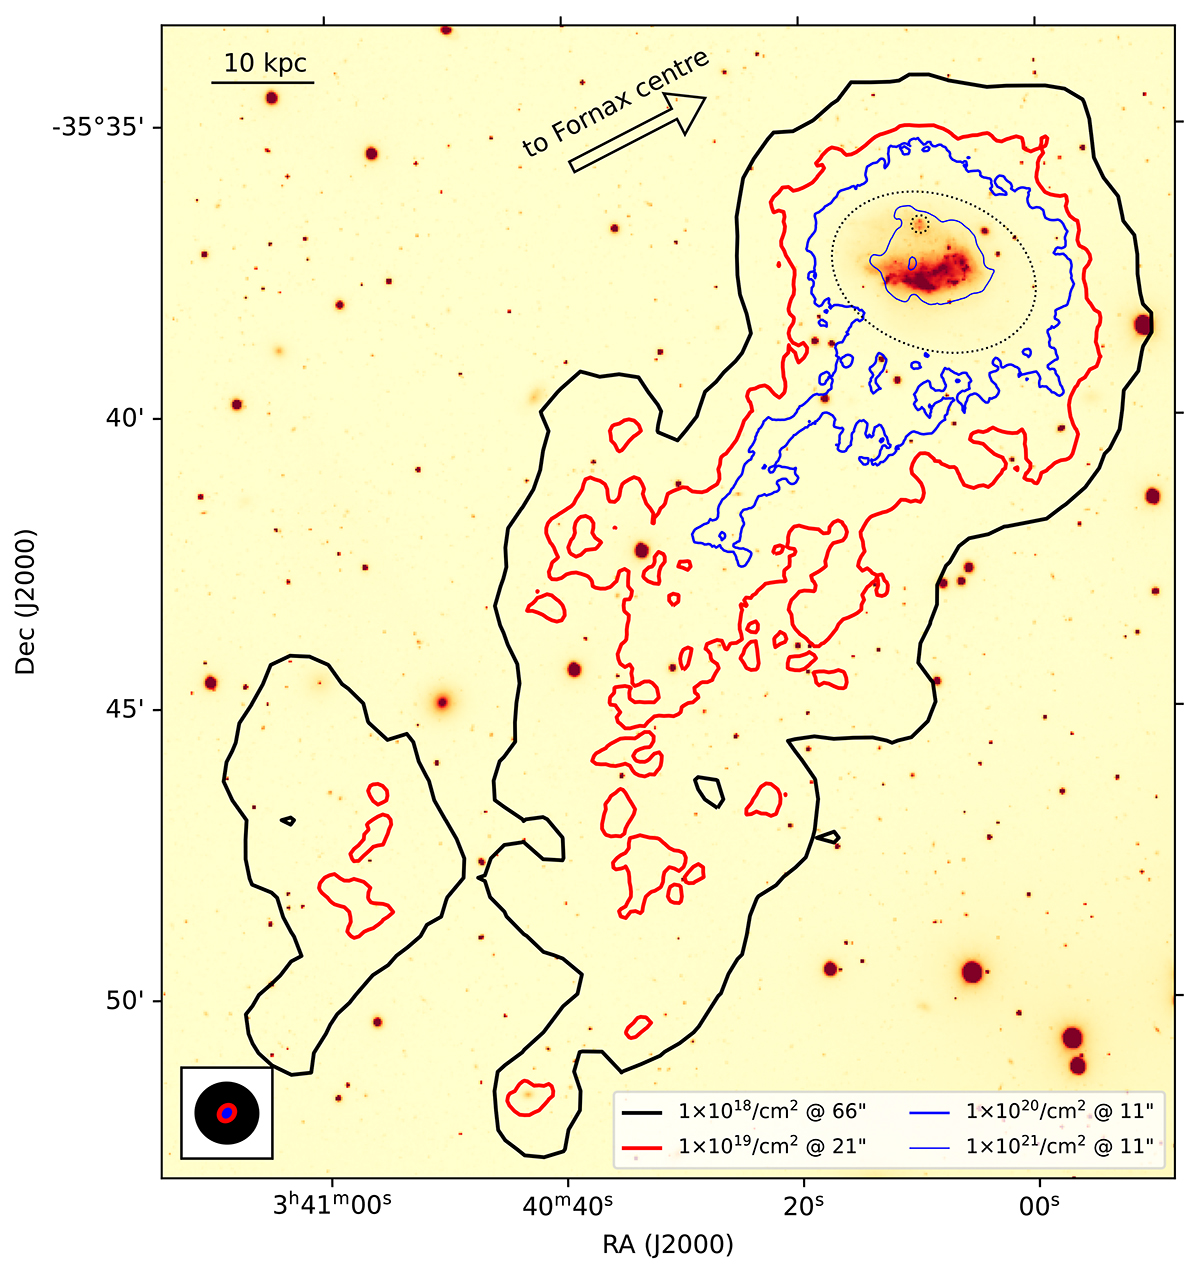
MeerKAT H I contours overlaid on a g-band optical image from the Fornax Deep Survey. The contours are drawn at different levels and resolutions as indicated in the legend on the bottom-right. The corresponding beam sizes are shown in the bottom-left corner. The dotted circle and ellipse represent the northern clump and the outer isophote of the stellar body, respectively (Fig. 1).
Current usage metrics show cumulative count of Article Views (full-text article views including HTML views, PDF and ePub downloads, according to the available data) and Abstracts Views on Vision4Press platform.
Data correspond to usage on the plateform after 2015. The current usage metrics is available 48-96 hours after online publication and is updated daily on week days.
Initial download of the metrics may take a while.