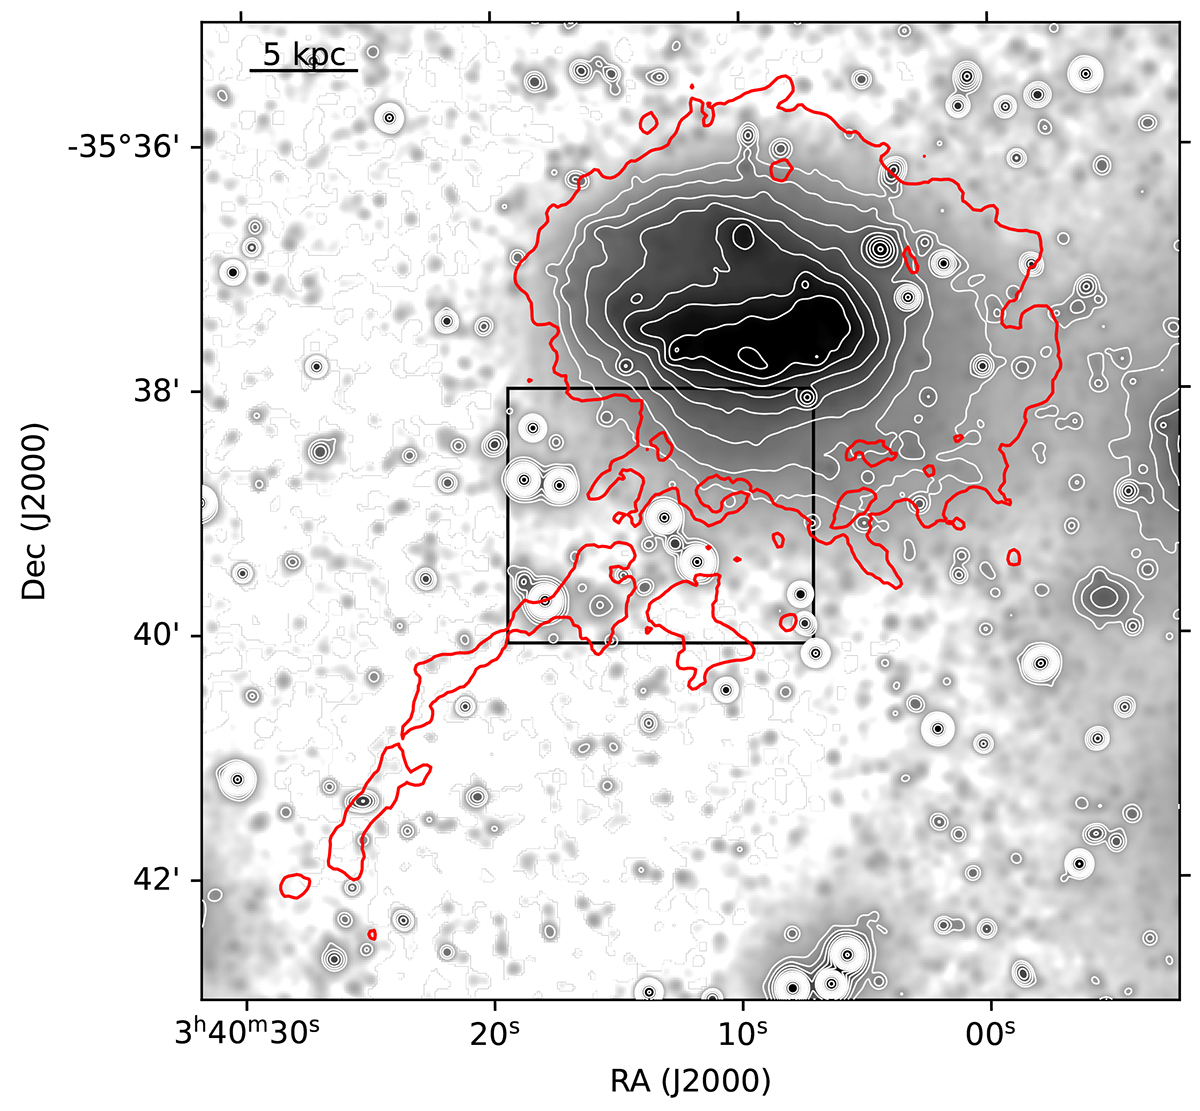
Fig. 14.
Download original image
Optical image (g-band, smoothed with a 5″-FWHM Gaussian kernel) and its contours (in white) with, overlaid, the 11″-resolution H I contour at N(H I) = 1.5 × 1020 cm−2 (in red). The black box highlights the region where the southern H I tail connects with the bump of the optical isophotes at the southern edge of the stellar body.
Current usage metrics show cumulative count of Article Views (full-text article views including HTML views, PDF and ePub downloads, according to the available data) and Abstracts Views on Vision4Press platform.
Data correspond to usage on the plateform after 2015. The current usage metrics is available 48-96 hours after online publication and is updated daily on week days.
Initial download of the metrics may take a while.