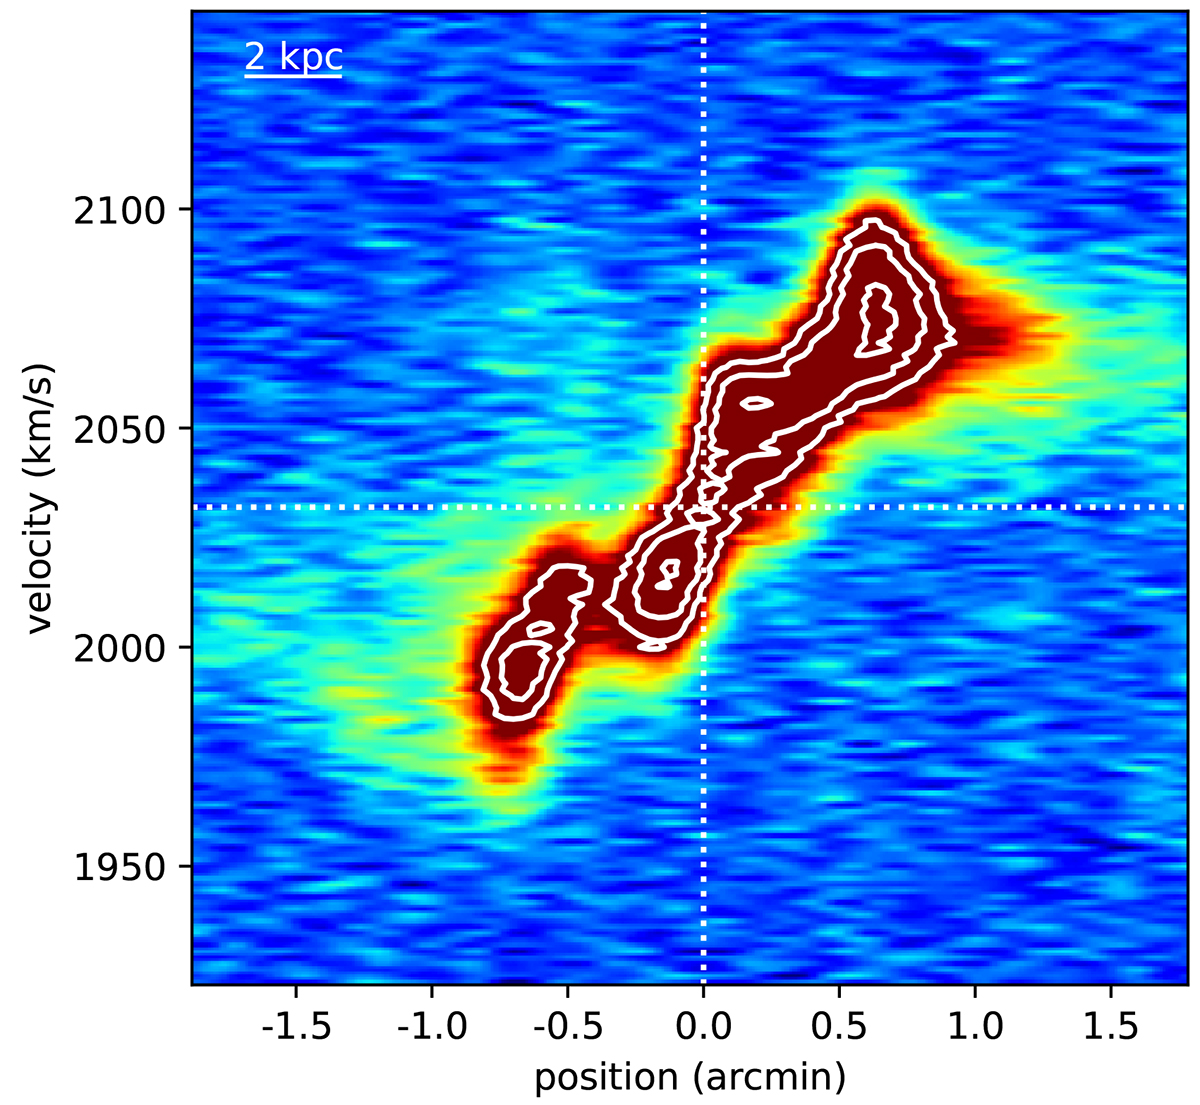
Fig. 11.
Download original image
H I position-velocity diagram along the H I kinematical major axis of NGC 1427A’s bright stellar body constructed using the 11″-resolution cube at full velocity resolution (1.4 km s−1). The diagram is centred at the dynamical centre and systemic velocity given in the text (vertical and horizontal white lines, respectively), and the axis has PA = 93°. The linear colour-scale ranges from −2σ to +8σ, where σ is the noise level. The white contours start at a +10σ level and increase by a factor ![]() at each step. East is left, west is right.
at each step. East is left, west is right.
Current usage metrics show cumulative count of Article Views (full-text article views including HTML views, PDF and ePub downloads, according to the available data) and Abstracts Views on Vision4Press platform.
Data correspond to usage on the plateform after 2015. The current usage metrics is available 48-96 hours after online publication and is updated daily on week days.
Initial download of the metrics may take a while.