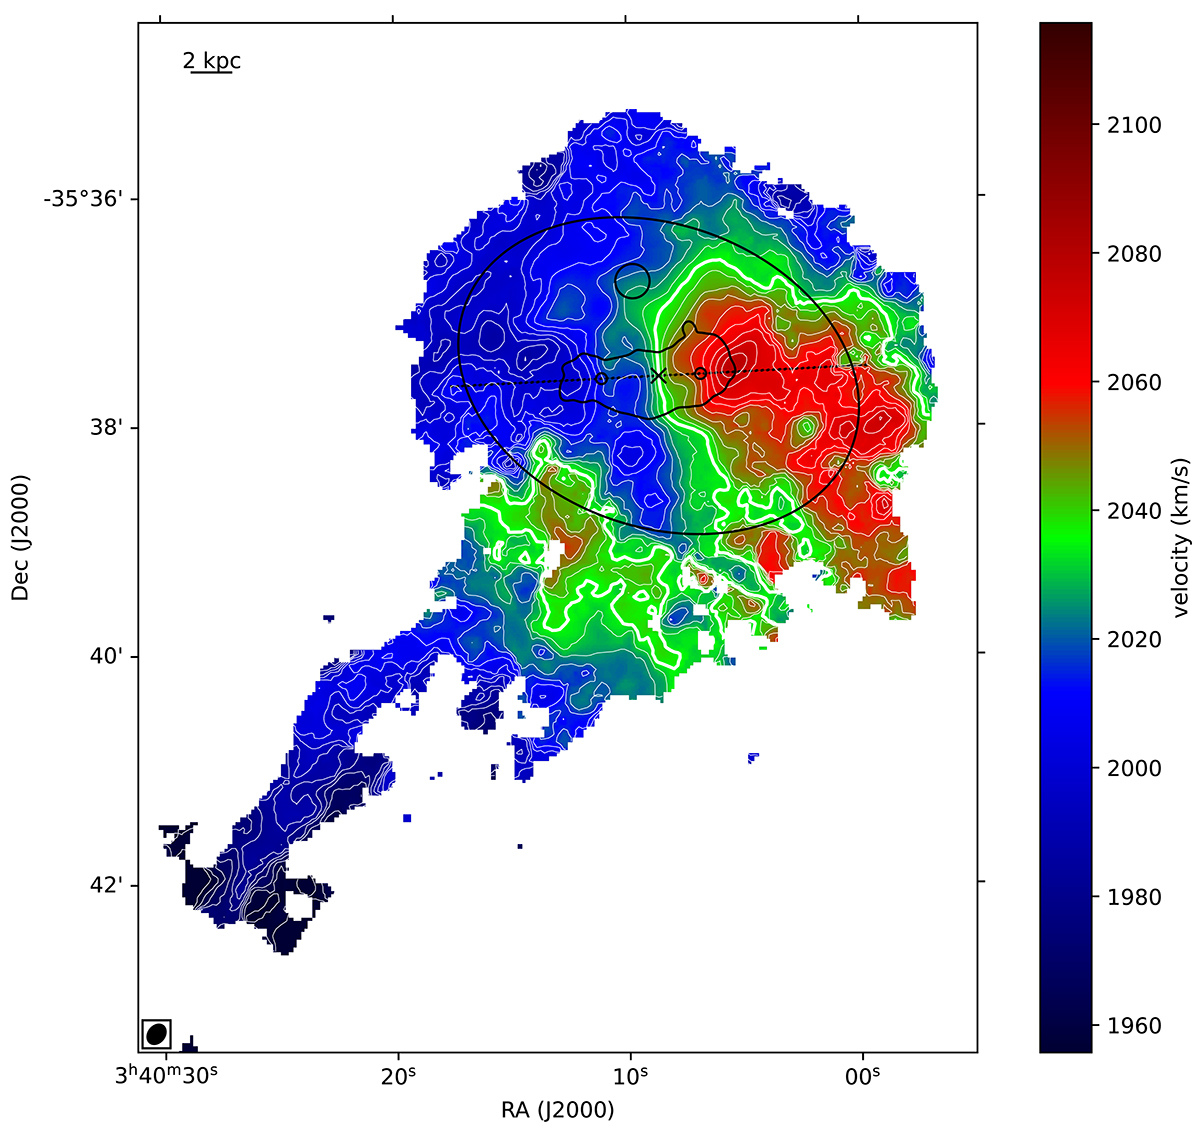
Fig. 10.
Download original image
Moment-1 velocity field at 11″ resolution, showing the regular rotation within the bright stellar body of NGC 1427A, the PA warp at its edge, the complex velocity structure in the outer H I envelope, and the velocity gradient along the densest part of the southern H I tail. The isovelocity white contours are drawn at ±n × 5 km s−1 intervals (n = 0, 1, 2, …) from the systemic velocity of 2036 km s−1. The systemic velocity itself is highlighted with a thick white contour and is at the centre of the colourbar. The dynamical centre is marked with a black cross (see text). The black dotted line represents the axis along which we draw the position-velocity diagram shown in Fig. 11. The two small, black open circles along that axis indicate the position of the velocity jumps visible in that diagram (see text). The black contours show the main features of the optical image (Fig. 1).
Current usage metrics show cumulative count of Article Views (full-text article views including HTML views, PDF and ePub downloads, according to the available data) and Abstracts Views on Vision4Press platform.
Data correspond to usage on the plateform after 2015. The current usage metrics is available 48-96 hours after online publication and is updated daily on week days.
Initial download of the metrics may take a while.