Fig. 8.
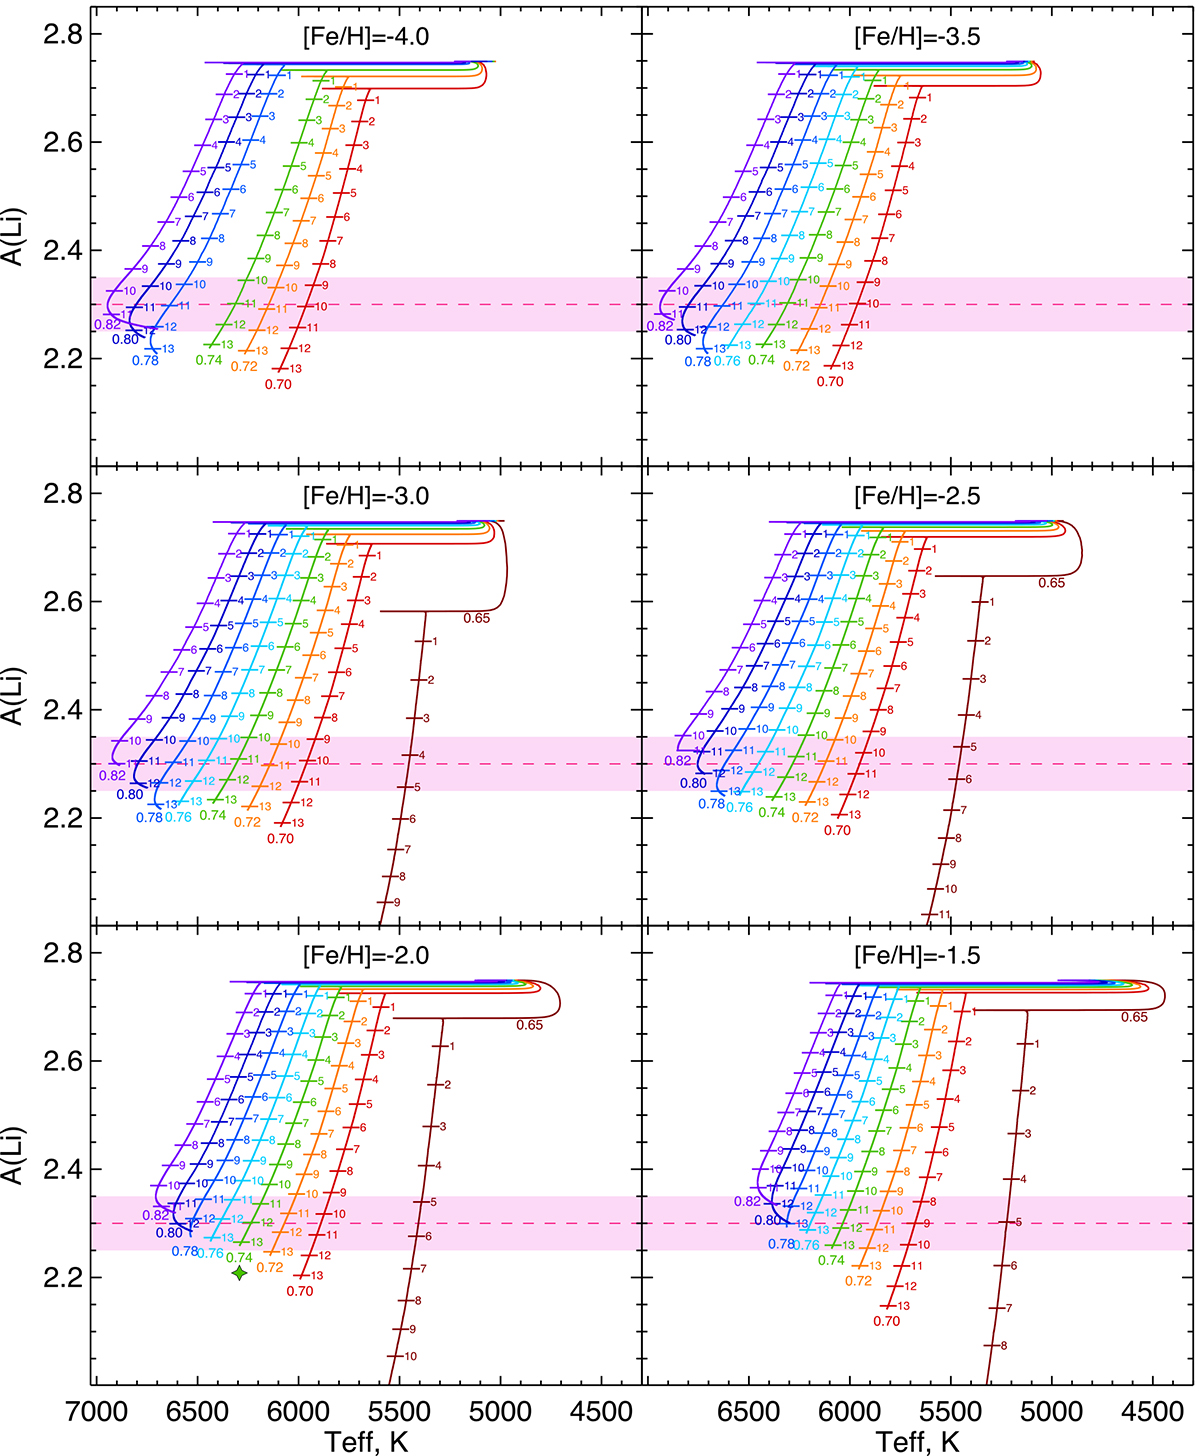
Download original image
Evolution of the surface Li abundance as a function of Teff for stars of different initial masses and different initial Fe content. Short horizontal ticks and numbers along the tracks indicate age in Gyr. The dashed horizontal line and surrounding pinkish area show the mean value of the Spite plateau (according to Norris et al. (2023)) and 0.05 dex scatter around it. The reference model is denoted with a four-pointed star.
Current usage metrics show cumulative count of Article Views (full-text article views including HTML views, PDF and ePub downloads, according to the available data) and Abstracts Views on Vision4Press platform.
Data correspond to usage on the plateform after 2015. The current usage metrics is available 48-96 hours after online publication and is updated daily on week days.
Initial download of the metrics may take a while.