Fig. 17.
Download original image
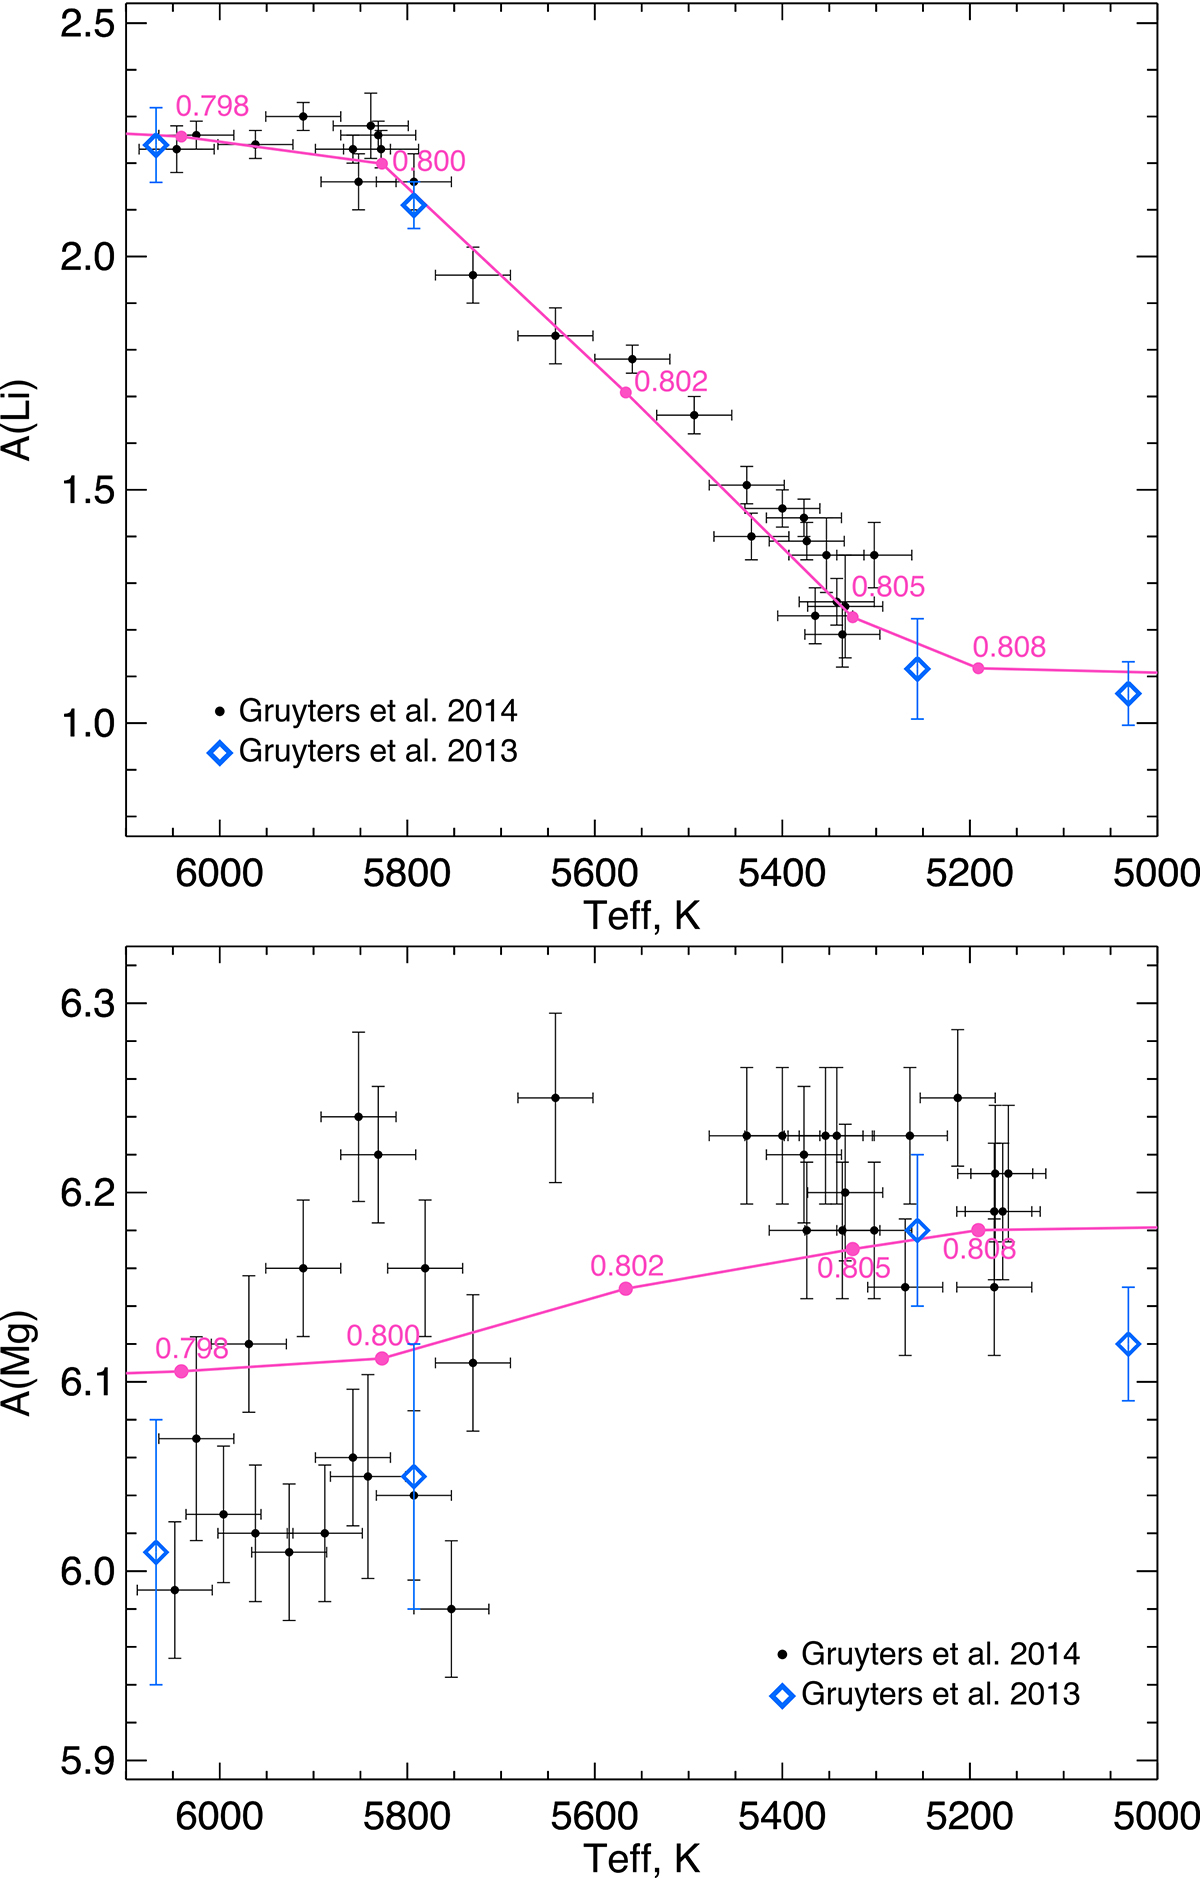
Upper panel: trend of Li abundance in stars of the primordial population of NGC 6752. Black points correspond to the data points from G14 and blue diamonds show the averaged values for different evolutionary stages of stars from G13 (turnoff, SGB, base of the RGB, RGB from left to right). The model prediction at 13.5 Gyr is shown with the magenta line with points labelled according to their mass. Bottom panel: same but for the abundance of Mg.
Current usage metrics show cumulative count of Article Views (full-text article views including HTML views, PDF and ePub downloads, according to the available data) and Abstracts Views on Vision4Press platform.
Data correspond to usage on the plateform after 2015. The current usage metrics is available 48-96 hours after online publication and is updated daily on week days.
Initial download of the metrics may take a while.