Fig. 11.
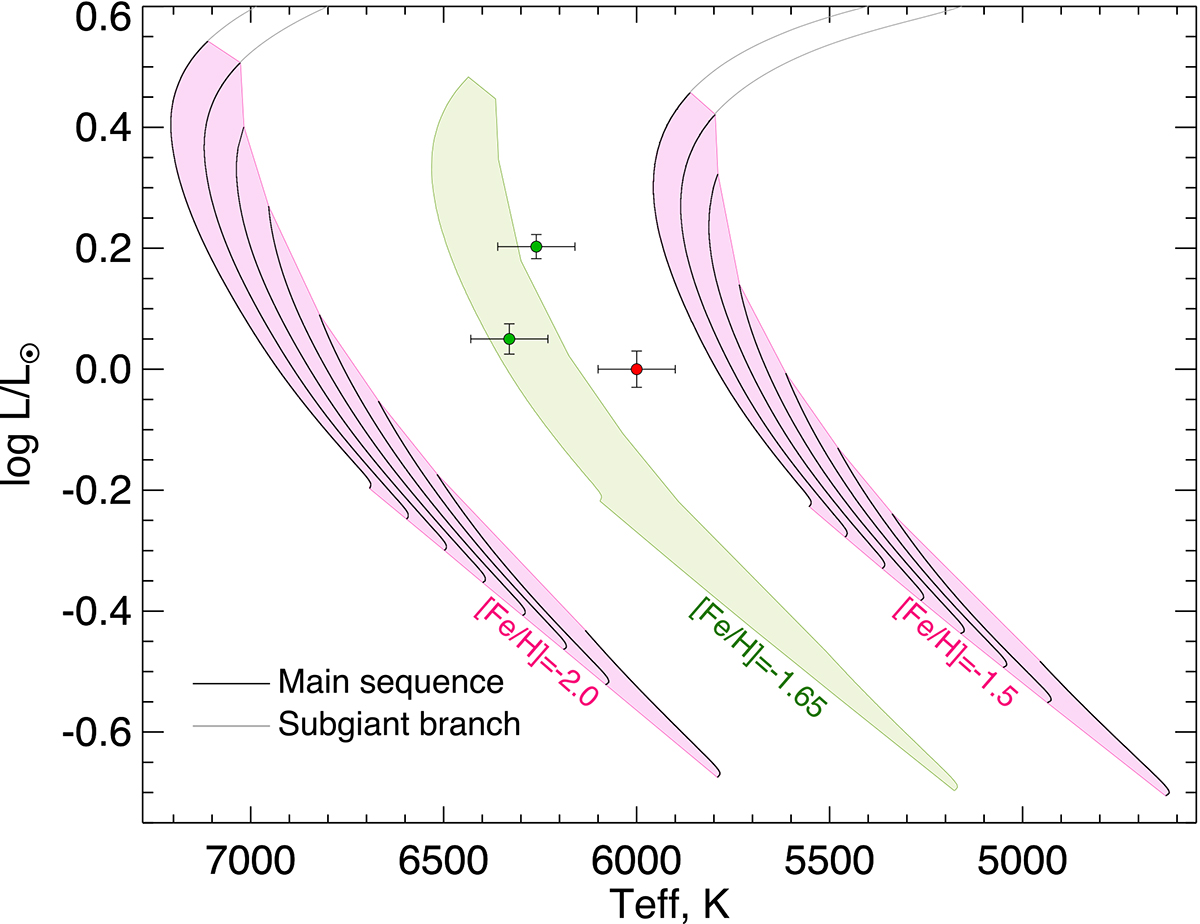
Download original image
Process of selection of dwarfs. Lines show evolutionary tracks for masses between 0.65 and 0.82 M⊙ and metallicities of [Fe/H] = −2.0 (left group tracks) and [Fe/H] = −1.5 (right group of tracks). For better visibility, the tracks for [Fe/H] = −2.0 and [Fe/H] = −1.5 were shifted by 500 K to the left and the right correspondingly. Black parts of the lines and pinkish areas indicate the main sequence, while grey lines show the subgiant stage. The green area is an interpolation of the main sequences from the presented tracks to the metallicity of [Fe/H] = −1.65. The points show mock stars that have different positions with respect to the interpolated main sequence area: one star is completely outside of the area even with its uncertainties, another one is outside but hits the area with its Teff uncertainty, and the last one is inside the area (last two are shown in green).
Current usage metrics show cumulative count of Article Views (full-text article views including HTML views, PDF and ePub downloads, according to the available data) and Abstracts Views on Vision4Press platform.
Data correspond to usage on the plateform after 2015. The current usage metrics is available 48-96 hours after online publication and is updated daily on week days.
Initial download of the metrics may take a while.