Fig. 10.
Download original image
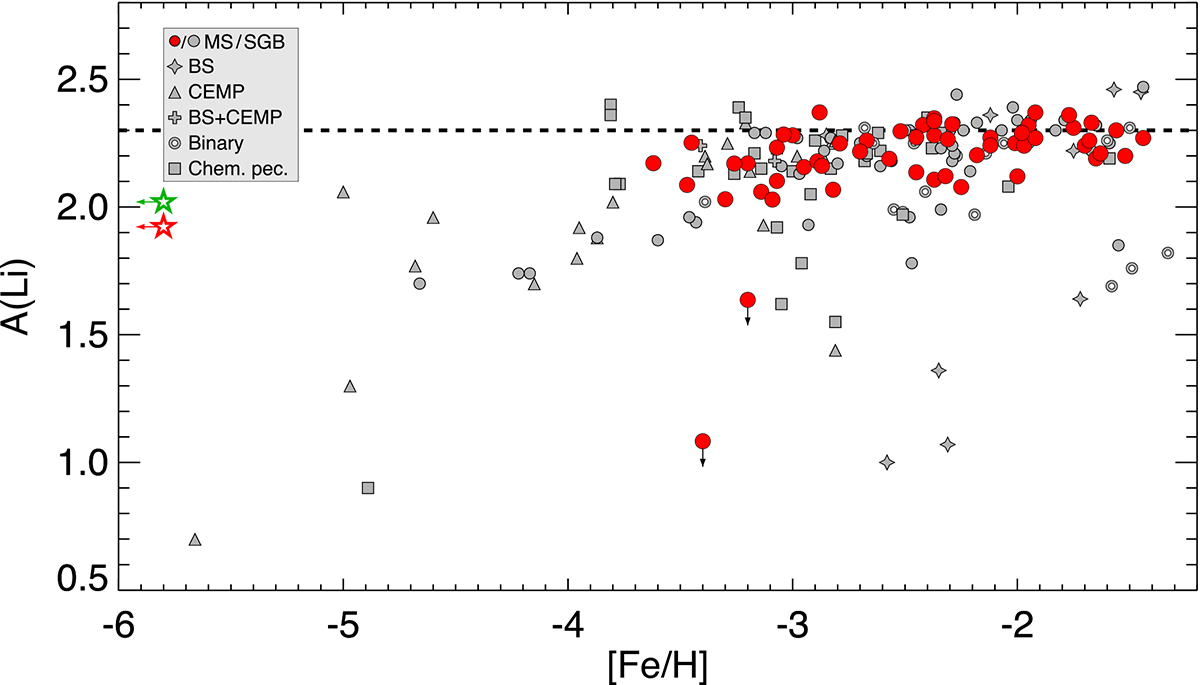
Li abundance (3D,NLTE) as a function of [Fe/H] for the N23 sample (‘Corrected-Literature’ values). We keep the same symbol notation as in Fig. 9. For the ’normal’ Plateau dwarf stars (red circles), the vertical arrows indicate Li upper limits. For the most Fe-poor dwarf, (shown with the red five-pointed star), J0023+0307, we also show the Li value determined by Aguado et al. (2019, green five-pointed star). The horizontal arrows indicate upper limits for [Fe/H]. The dashed line indicates the Spite plateau value of A(Li) = 2.3 dex used for the calibration of our models.
Current usage metrics show cumulative count of Article Views (full-text article views including HTML views, PDF and ePub downloads, according to the available data) and Abstracts Views on Vision4Press platform.
Data correspond to usage on the plateform after 2015. The current usage metrics is available 48-96 hours after online publication and is updated daily on week days.
Initial download of the metrics may take a while.