Open Access
Fig. 7.
Download original image
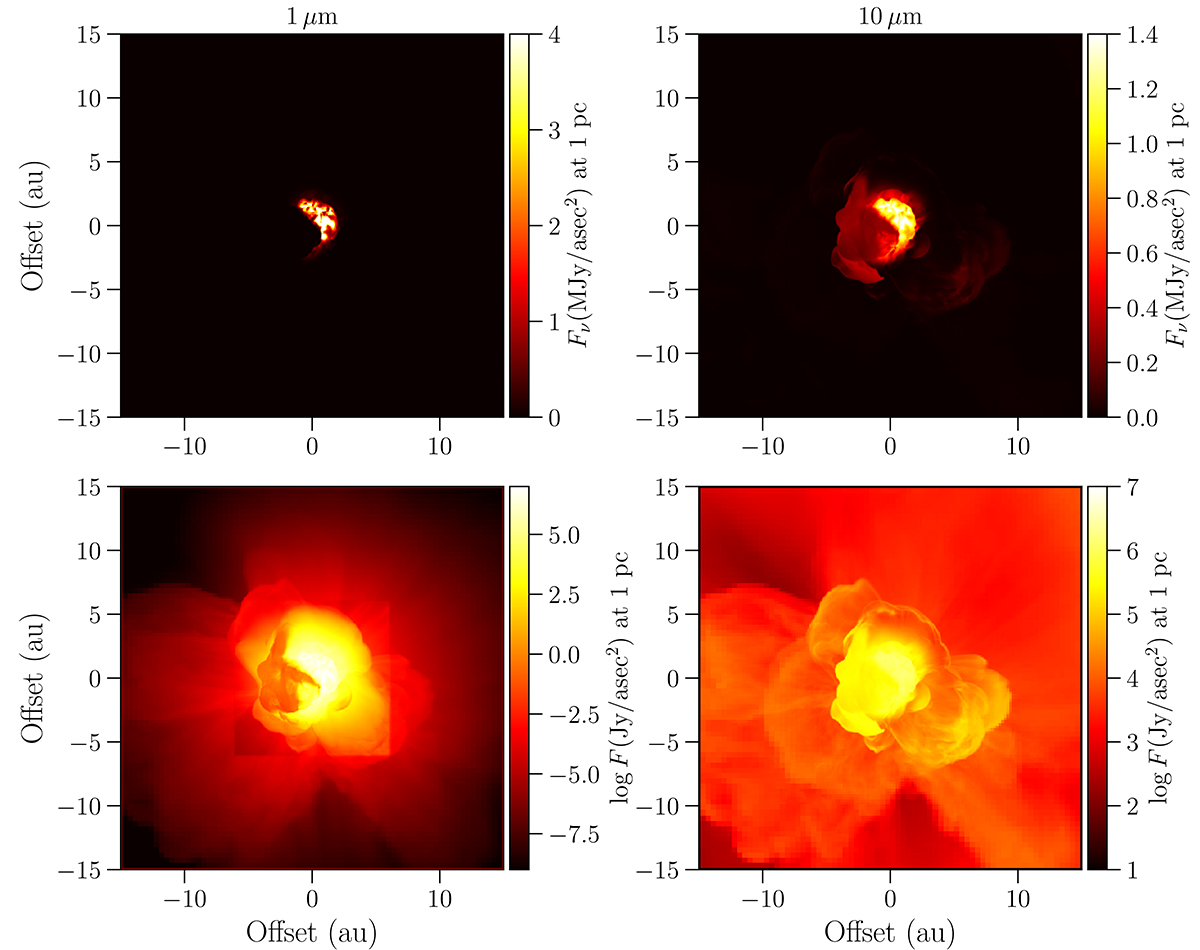
Images created with RADMC-3D from st28gm06n052 at 1 and 10 μm and as seen from the 0–0 angles (i = 0° and ϕ = 0°). The top row has a linear flux scale, and the bottom row has a logarithmic flux scale as indicated by the colour bars where the flux densities are normalised to a distance of 1 pc.
Current usage metrics show cumulative count of Article Views (full-text article views including HTML views, PDF and ePub downloads, according to the available data) and Abstracts Views on Vision4Press platform.
Data correspond to usage on the plateform after 2015. The current usage metrics is available 48-96 hours after online publication and is updated daily on week days.
Initial download of the metrics may take a while.