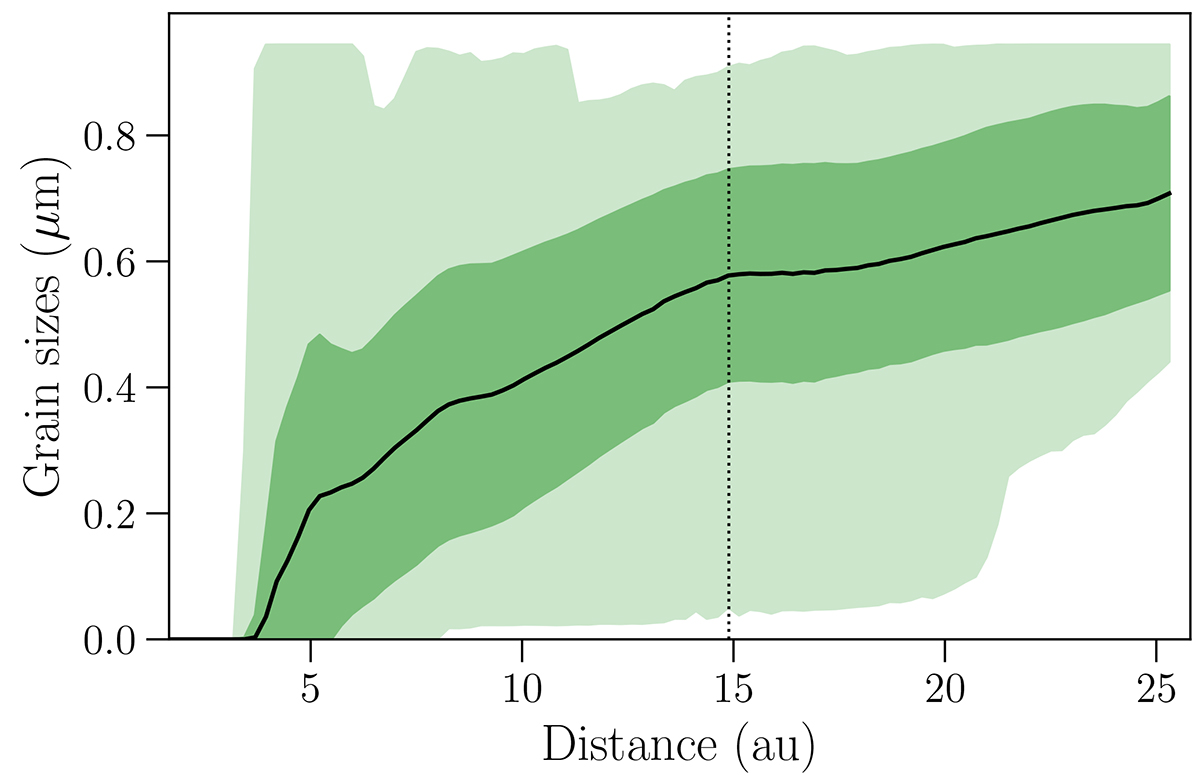
Fig. 4.
Download original image
Grain sizes from st28gm06n052 against radial distance from the centre of the RADMC-3D-grid in 100 spherical shells. The plot starts approximately at the stellar surface, 1.65 au. The middle black curve is the average grain size of each shell, the darker green field is the standard deviation of the grain sizes, and the lighter and widest green field is the minimum to maximum grain size range. The black vertical dots indicate half the size of the computational box (centre to edge along an axis).
Current usage metrics show cumulative count of Article Views (full-text article views including HTML views, PDF and ePub downloads, according to the available data) and Abstracts Views on Vision4Press platform.
Data correspond to usage on the plateform after 2015. The current usage metrics is available 48-96 hours after online publication and is updated daily on week days.
Initial download of the metrics may take a while.