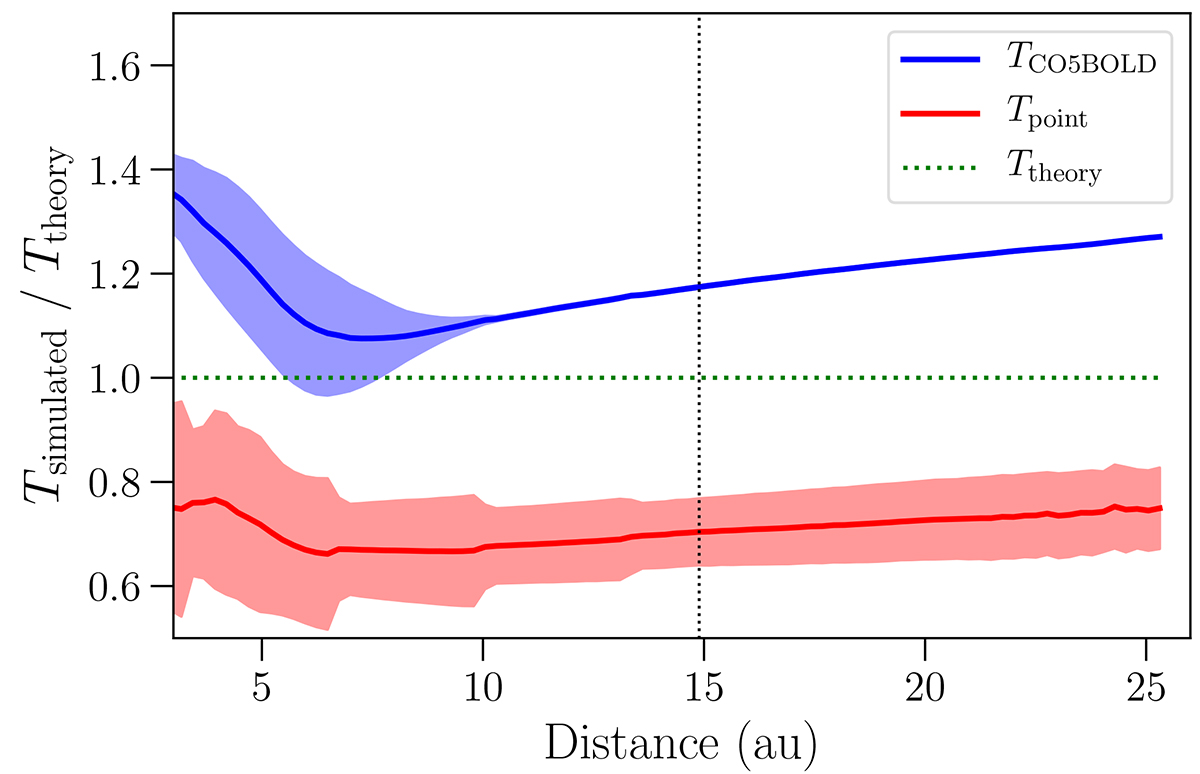
Fig. A.3.
Download original image
Ratio of dust temperatures used in the radiative transfer to the power-law temperature profile from Eq. (A.1) (indicated by the green horizontal dotted line). The middle line of each curve is the average value of each shell, and the dark field is the standard deviation of each shell. The plot starts at 3 au, which is just below where dust forms at this snapshot (3.4 au). The vertical black dots indicate half the edge length (centre to edge distance) of the computation box.
Current usage metrics show cumulative count of Article Views (full-text article views including HTML views, PDF and ePub downloads, according to the available data) and Abstracts Views on Vision4Press platform.
Data correspond to usage on the plateform after 2015. The current usage metrics is available 48-96 hours after online publication and is updated daily on week days.
Initial download of the metrics may take a while.