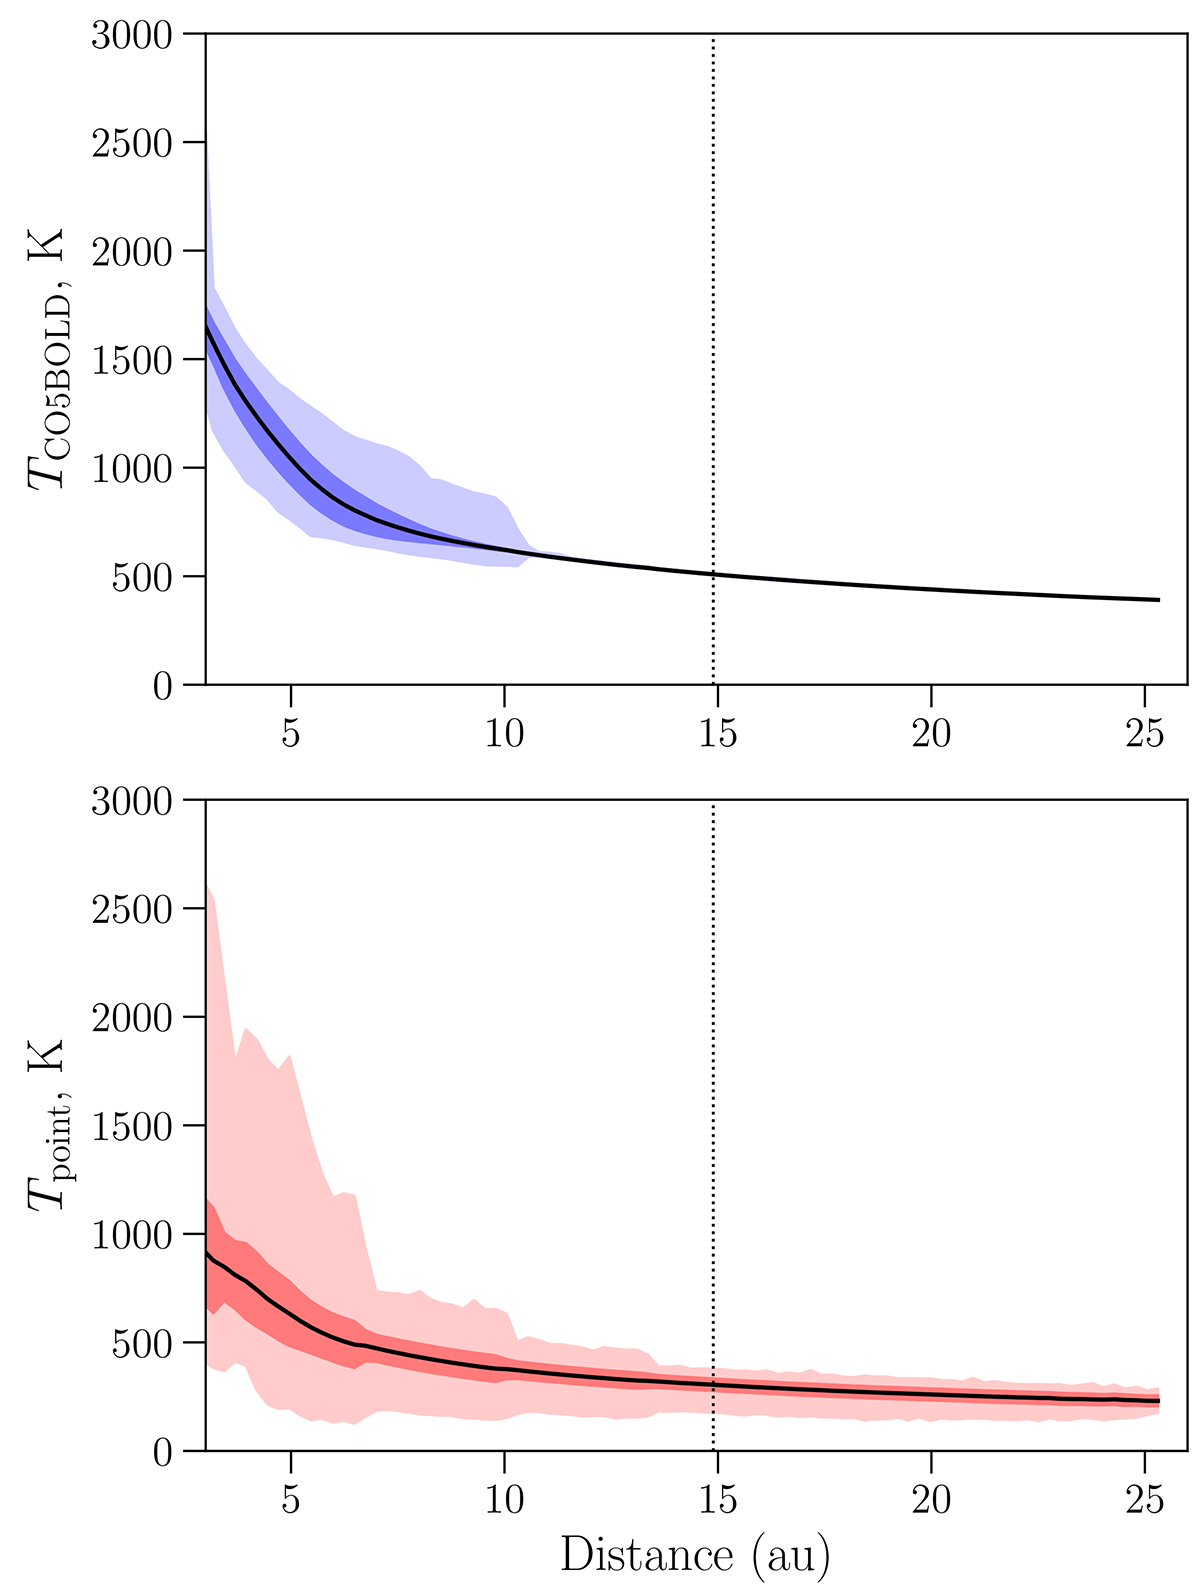
Fig. A.2.
Download original image
Radial average temperatures of 100 spherical shells of st28gm06n052. The top panel shows the temperatures as computed with CO5BOLD. The bottom panel shows the dust temperatures computed in RADMC-3D with a point source at the centre that approximates the star in st28gm06n052. The middle line of each curve is the average temperature of each shell, the narrow darker field is the temperature’s standard deviation of each shell, and the wide light field show the minimum and maximum temperature of each shell. The plots start at 3 au, which is just below where dust forms at this snapshot (3.4 au). The vertical black dots indicate half the edge length (centre to box edge) of the computation box.
Current usage metrics show cumulative count of Article Views (full-text article views including HTML views, PDF and ePub downloads, according to the available data) and Abstracts Views on Vision4Press platform.
Data correspond to usage on the plateform after 2015. The current usage metrics is available 48-96 hours after online publication and is updated daily on week days.
Initial download of the metrics may take a while.