Fig. 11.
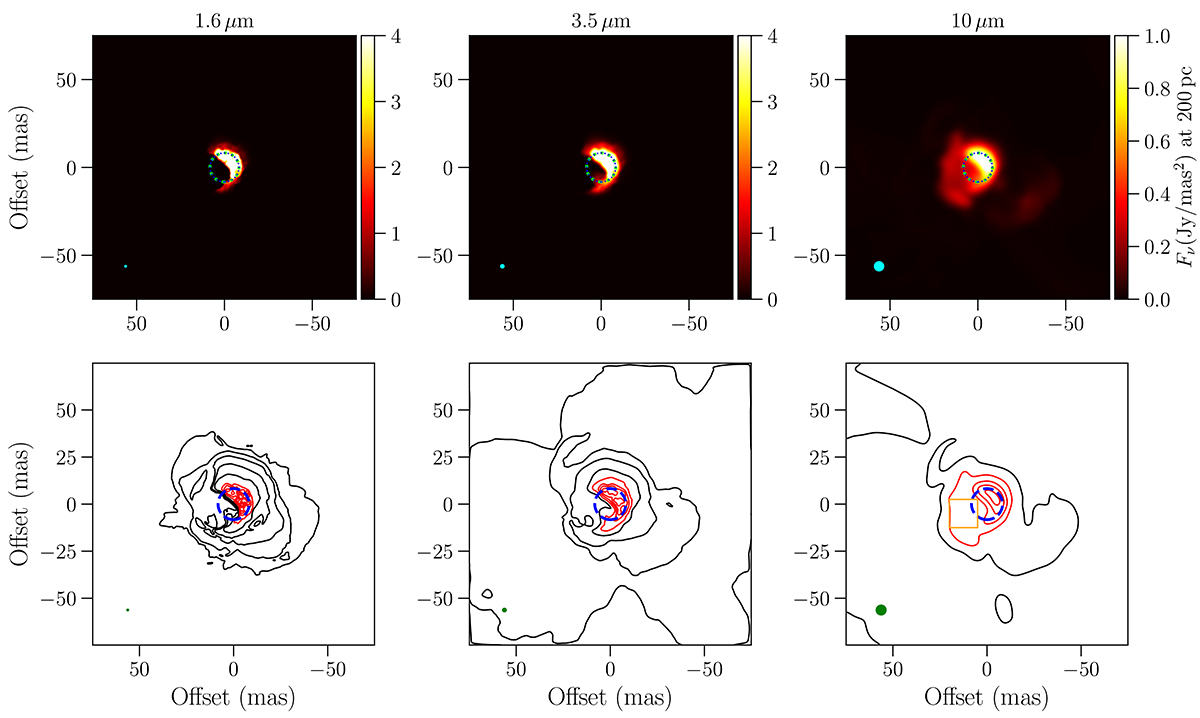
Download original image
Images and contour plots of the CO5BOLD-model st28gm06n052 simulated with RADMC-3D at a distance of 200 pc as convolved by Gaussian beams that correspond to the angular resolutions that VLTI can achieve (see text for details). The beam FWHMs are indicated by the cyan (top row) or green (bottom row) circles in the panels’ lower left corners. Stellar average radius, 1.65 au, is indicated with the dotted circle in the centre of the panels. The red contours in the bottom row show flux densities that are ≥0.1 times the image’s maximum flux density, and the orange patch in the bottom λ = 10 μm plot is an area of dust where we measure the patch flux density in Table 4.
Current usage metrics show cumulative count of Article Views (full-text article views including HTML views, PDF and ePub downloads, according to the available data) and Abstracts Views on Vision4Press platform.
Data correspond to usage on the plateform after 2015. The current usage metrics is available 48-96 hours after online publication and is updated daily on week days.
Initial download of the metrics may take a while.