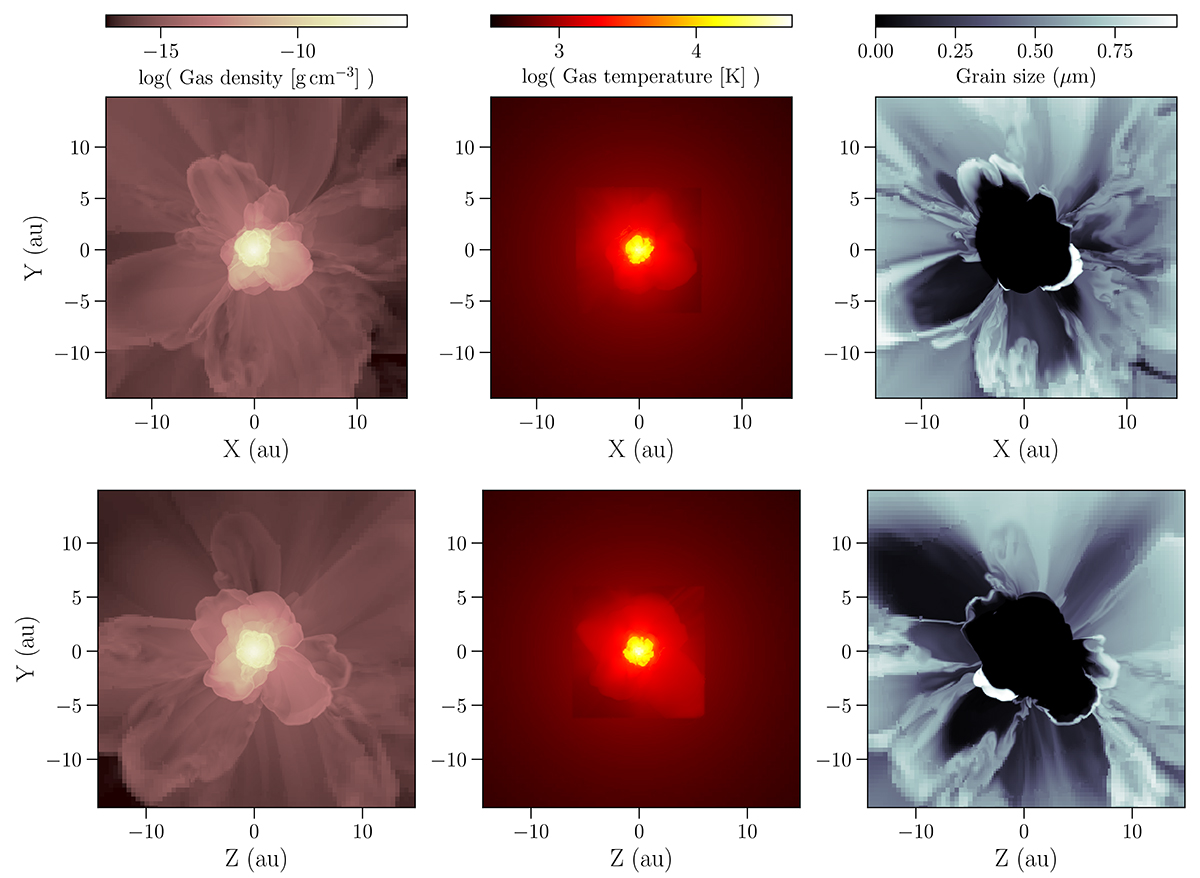
Fig. 1.
Download original image
Images of a cut through the centre of the grid of a snapshot of model st28gm06n052 mapped to the RADMC-3D grid described in Sect. 3.1. The first row shows a 2D slice of the X − Y plane, and the second row shows the Y − Z plane. The left panels show gas densities, the middle panels show gas temperatures, and the right panels show grain sizes.
Current usage metrics show cumulative count of Article Views (full-text article views including HTML views, PDF and ePub downloads, according to the available data) and Abstracts Views on Vision4Press platform.
Data correspond to usage on the plateform after 2015. The current usage metrics is available 48-96 hours after online publication and is updated daily on week days.
Initial download of the metrics may take a while.