Fig. B.1
Download original image
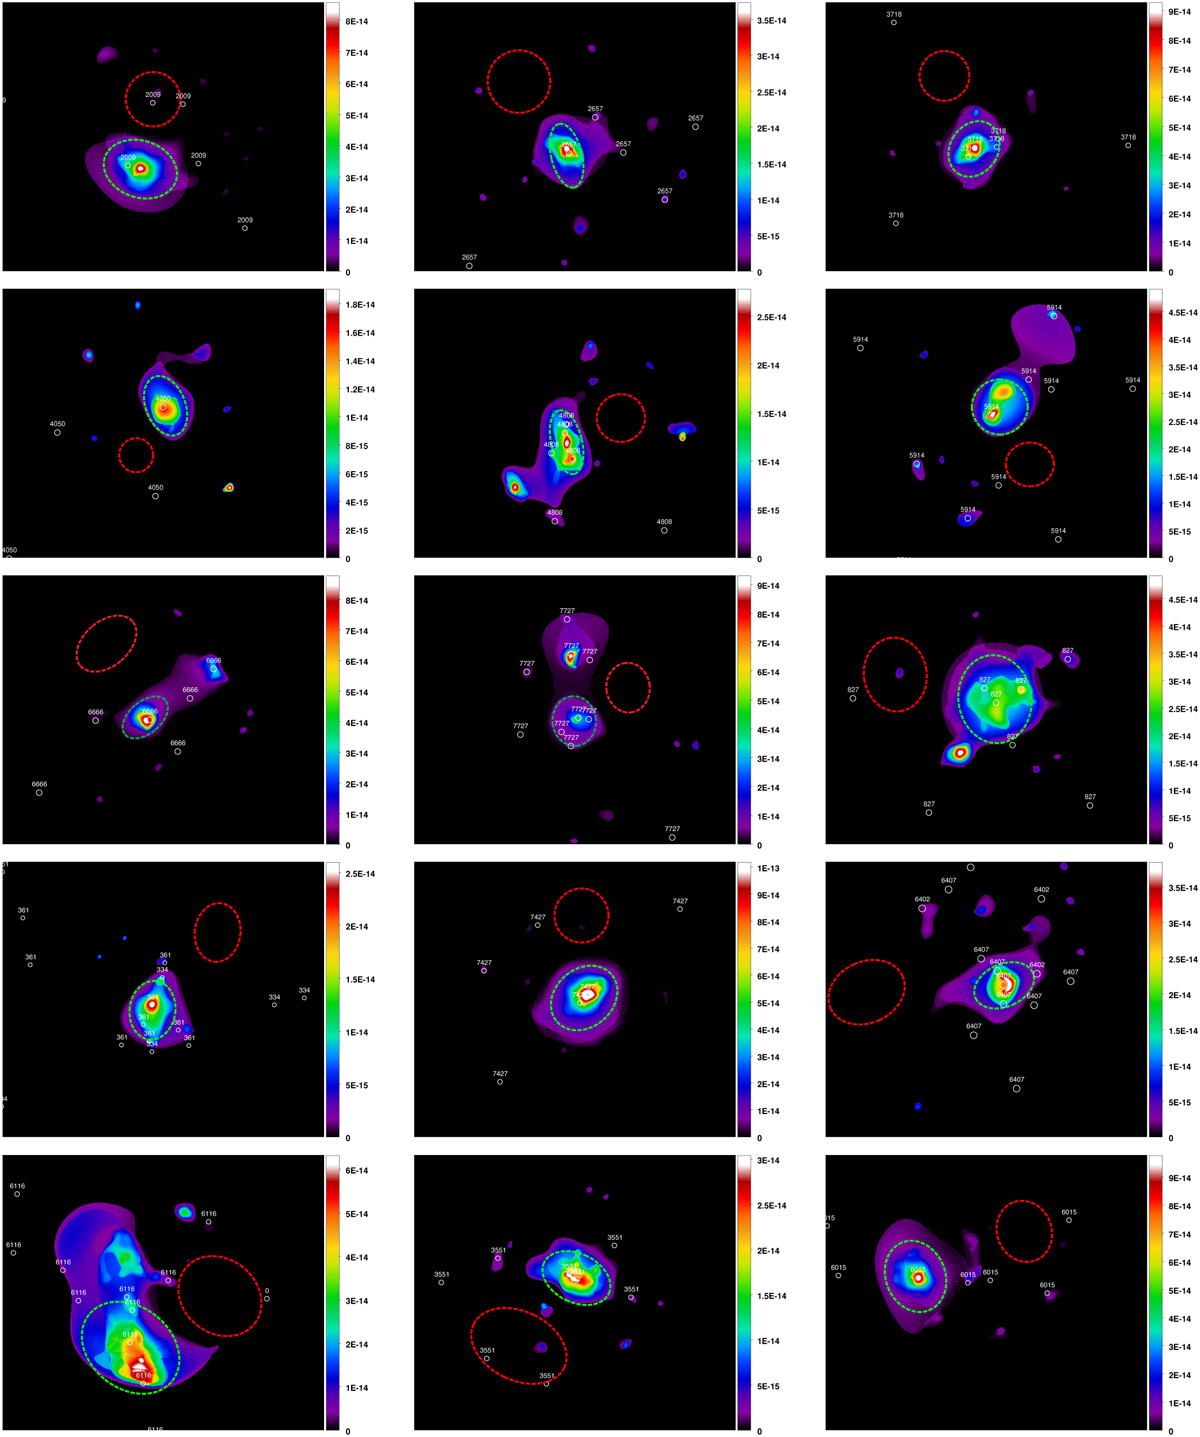
Twenty-five XMM-Newton X-ray pointings for the full sample used in this work. Green dashed ellipses are spectral extraction regions. Red dashed ellipses are background extraction regions. Small white circles represent member galaxies in each group, each denoted with the respective group ID. The colour bar scale is given in counts per second per square centimetre per square arcminute.
Current usage metrics show cumulative count of Article Views (full-text article views including HTML views, PDF and ePub downloads, according to the available data) and Abstracts Views on Vision4Press platform.
Data correspond to usage on the plateform after 2015. The current usage metrics is available 48-96 hours after online publication and is updated daily on week days.
Initial download of the metrics may take a while.