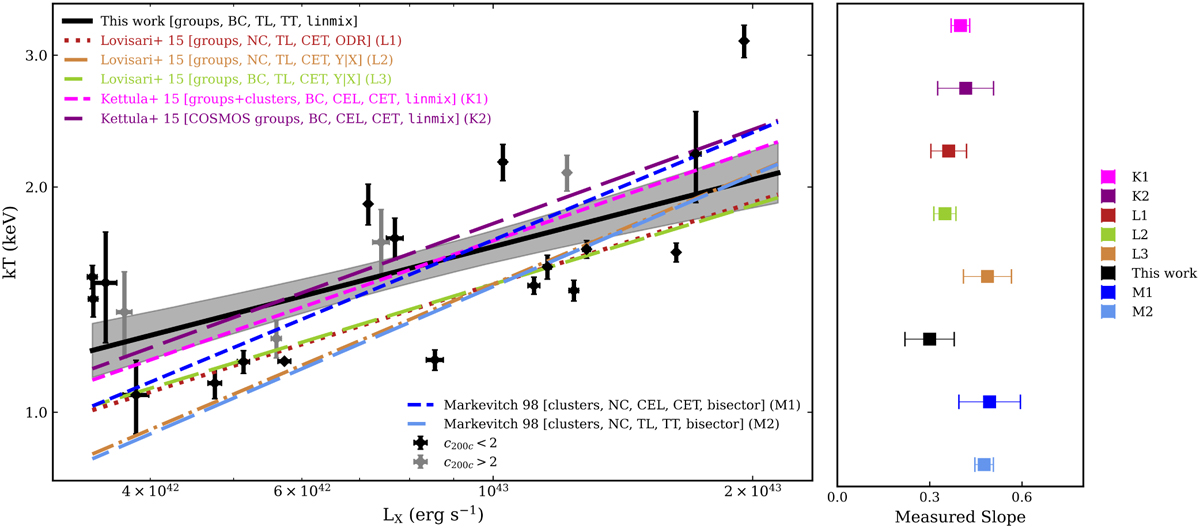
Fig. 20
Download original image
X-ray temperature versus luminosity. Left panel: temperature versus X-ray luminosity for the XMM-Newton subsample used in this work (black solid line) in comparison with the literature. The terms BC and NC indicate bias-corrected and non-corrected relations, respectively, while TL and CEL are total and core-excised LX, respectively. The abbreviations TT and CET are for total and core-excised kT, respectively. The type of the sample used and the regression method are also indicated (see Sect. 4.5 for more details). Grey and black points are high and low concentration groups, respectively, defined at c200 = 2. The shaded region is the 1-σ uncertainty. Right panel: comparison of the slope of the kT–LX relation with the literature. Slope labels are the same as relation labels from the left panel. Only band-limited L0.1–2.4 relations are considered.
Current usage metrics show cumulative count of Article Views (full-text article views including HTML views, PDF and ePub downloads, according to the available data) and Abstracts Views on Vision4Press platform.
Data correspond to usage on the plateform after 2015. The current usage metrics is available 48-96 hours after online publication and is updated daily on week days.
Initial download of the metrics may take a while.